Sentinel-As-Code: Wave 4, the docs nobody wanted to write

Nobody likes writing documentation. Even when you do write it, it starts dying the moment you save the file. Someone tweaks a setting in the portal, swaps a connector, changes a detection rule, and your carefully written workspace document is quietly drifting out of date for whoever reads it next. (That's assuming anyone still reads documentation these days, rather than pasting it into an AI and asking it to explain the whole thing like they're five.)
I used to love writing documentation. There was something satisfying about laying out a process and picturing someone following it for years. These days I have so many projects on the go that documentation is an afterthought, written in a hurry if it gets written at all.
The honest fix isn't more discipline. It's to stop writing the documentation by hand at all. If the document is generated from the live workspace every day, it can't drift, because there's nothing to keep up to date and nobody maintaining it. It's a snapshot of what's actually there, not a memory of what someone set up six months ago.
That's Wave 4. Wave 3 was the operating-system release: the PR gate, the shared Sentinel.Common module, pipeline parity, a self-writing dependency manifest. It made the repo trustworthy. Wave 4 turns that same instinct on documentation and asks a simpler question. What's actually deployed in the workspace right now, and is any of it costing you money, missing coverage, or quietly drifting from Microsoft's own best practices?
The answer is the Sentinel Documenter. It's effectively the whole release: one tool that writes the docs nobody wanted to write, keeps them honest every single morning, and asks nothing of you in return.
The short list:
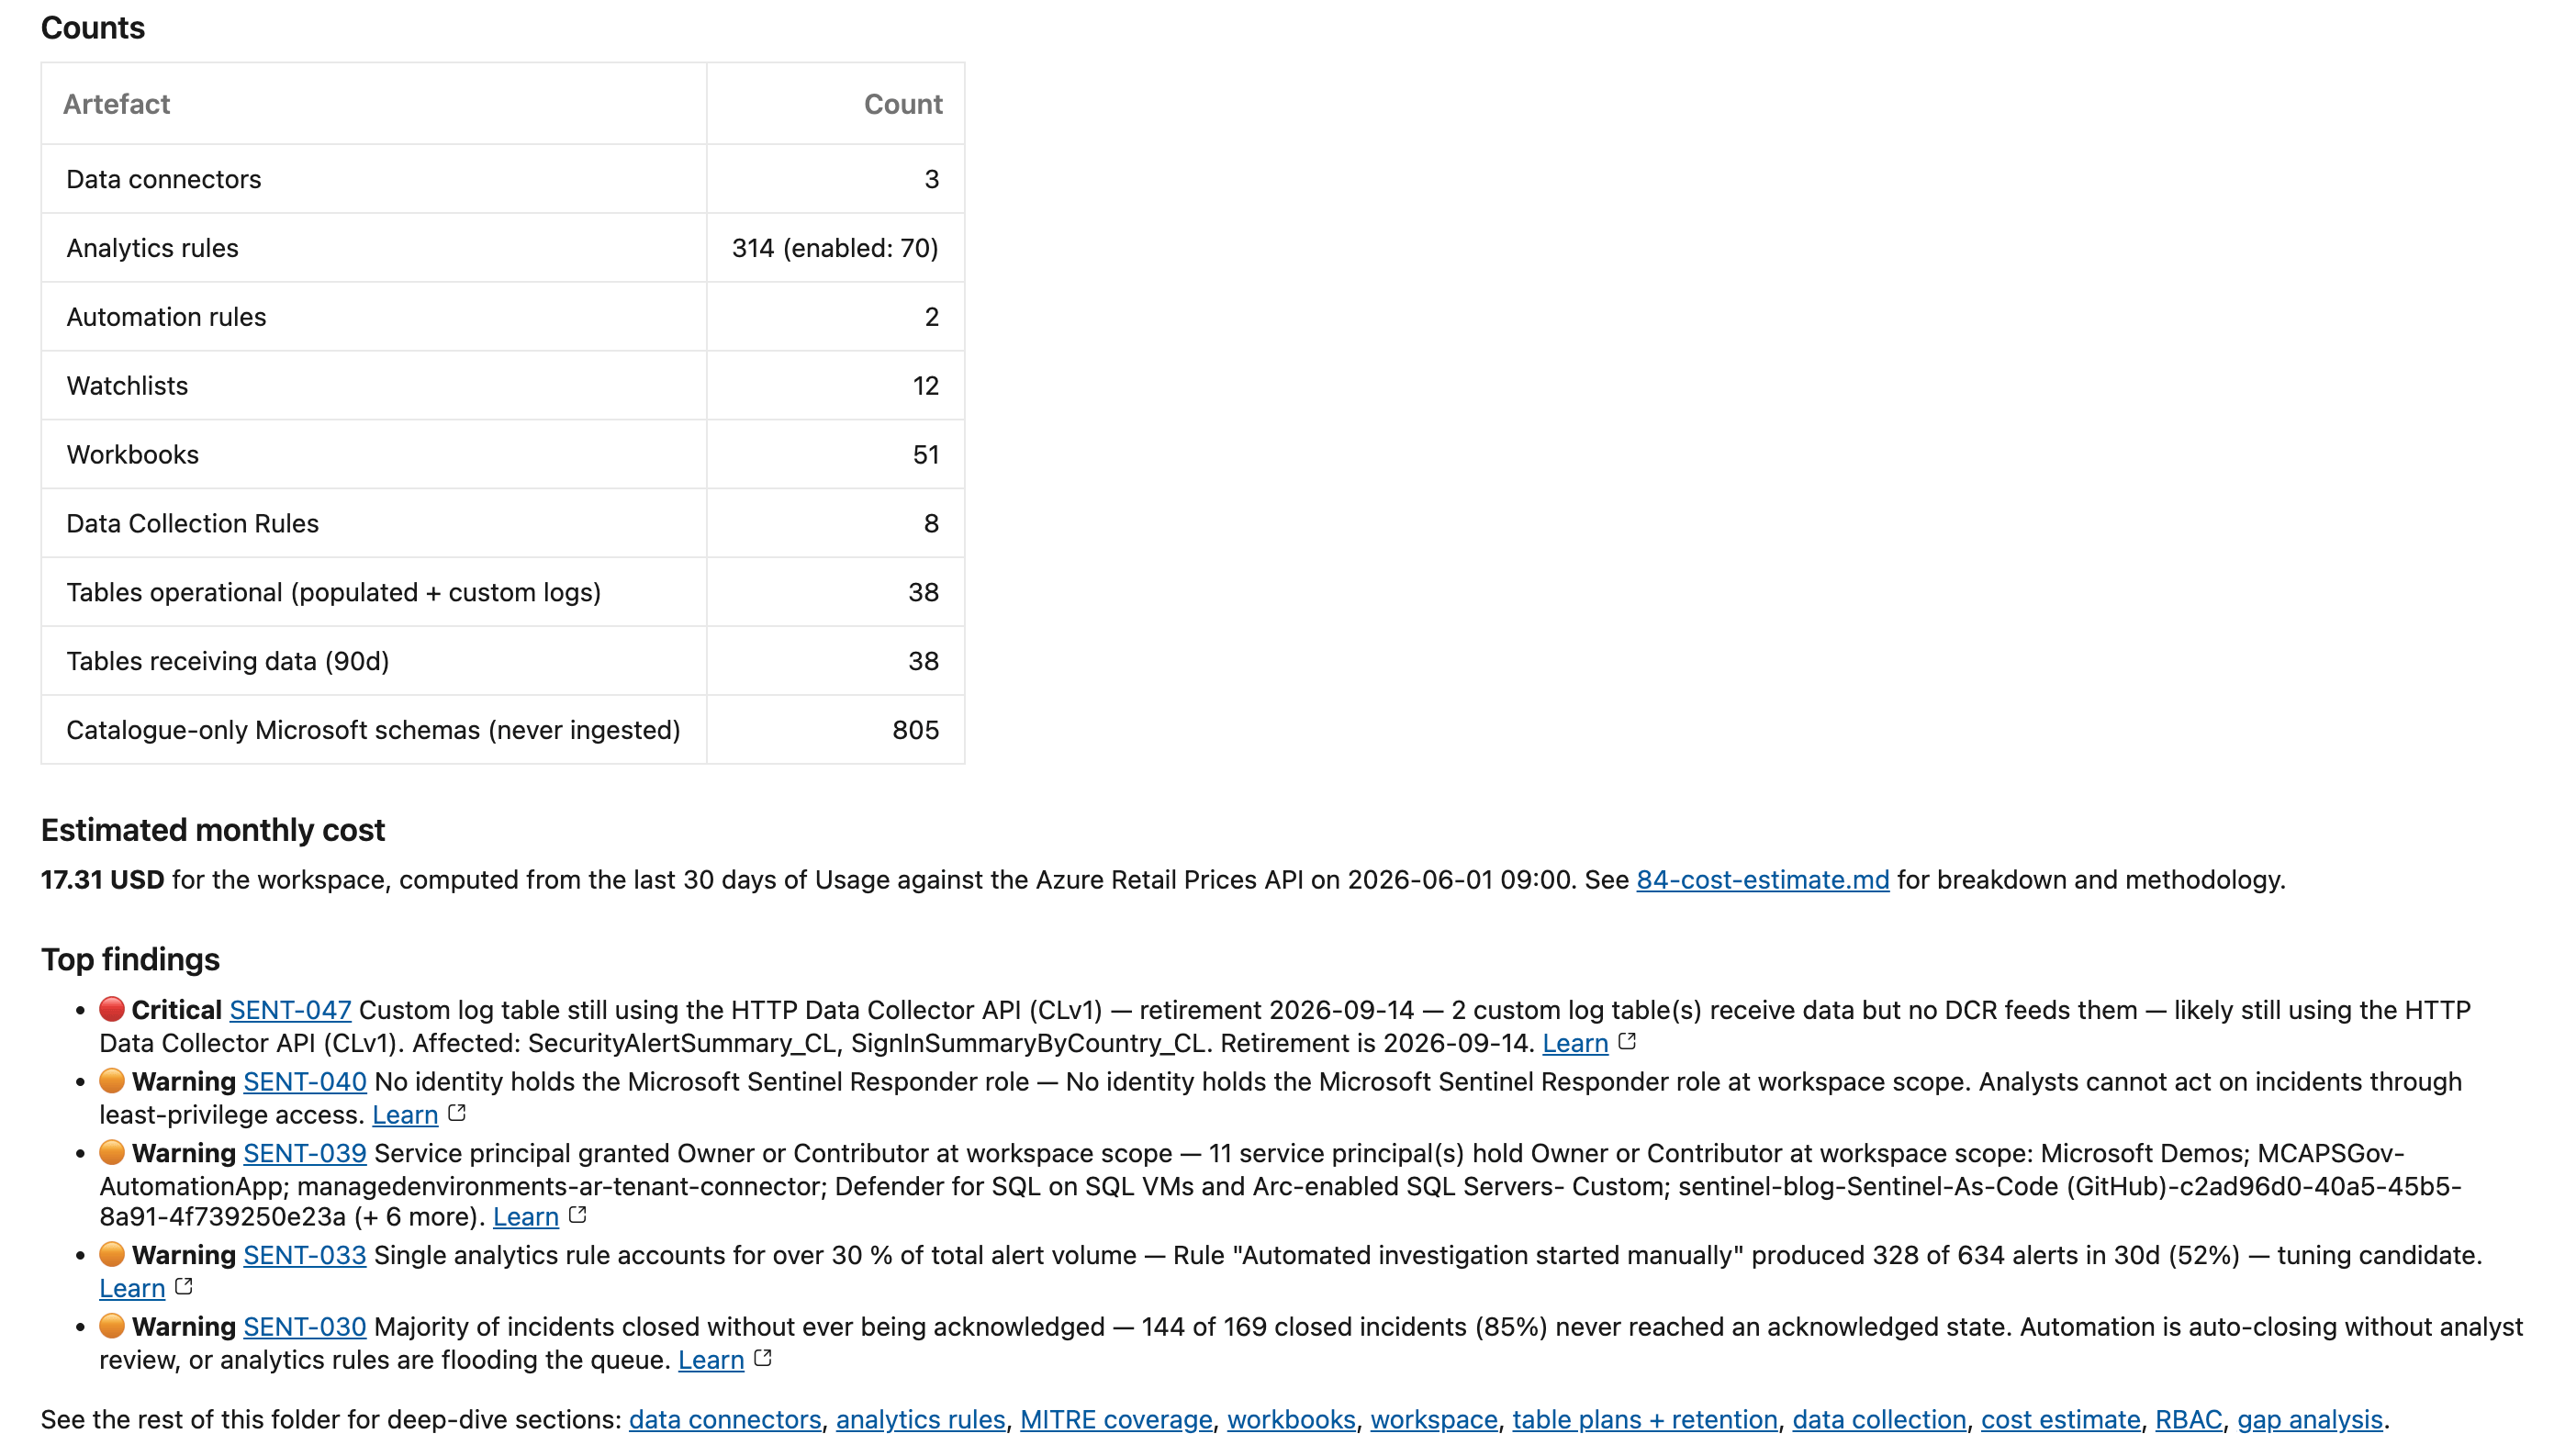
- A read-only Documenter runs daily against a live workspace and renders living Markdown documentation covering many artefacts, multiple setting, DCRs and DCEs, an estimated monthly cost, and a findings list scored against Microsoft best practices.
- The tool splits into a collector (talks to Azure) and a renderer (pure file-to-file). The renderer is fully offline and gives the same output for the same input, so you can re-run it on a downloaded artefact with no auth. That's also how the Pester suite drives it end-to-end.
- A gap engine of small
Test-*rules turns "the workspace" into a scored findings list: daily cap missing, MMA and CLv1 deprecation deadlines, MITRE blind spots, orphan and silent tables, over-broad RBAC. Adding a rule is a small change. - An opinionated cost estimator prices recent ingest against the public Azure Retail Prices API, attributes it per table plan, applies the Sentinel free benefit, and projects a commitment-tier what-if.
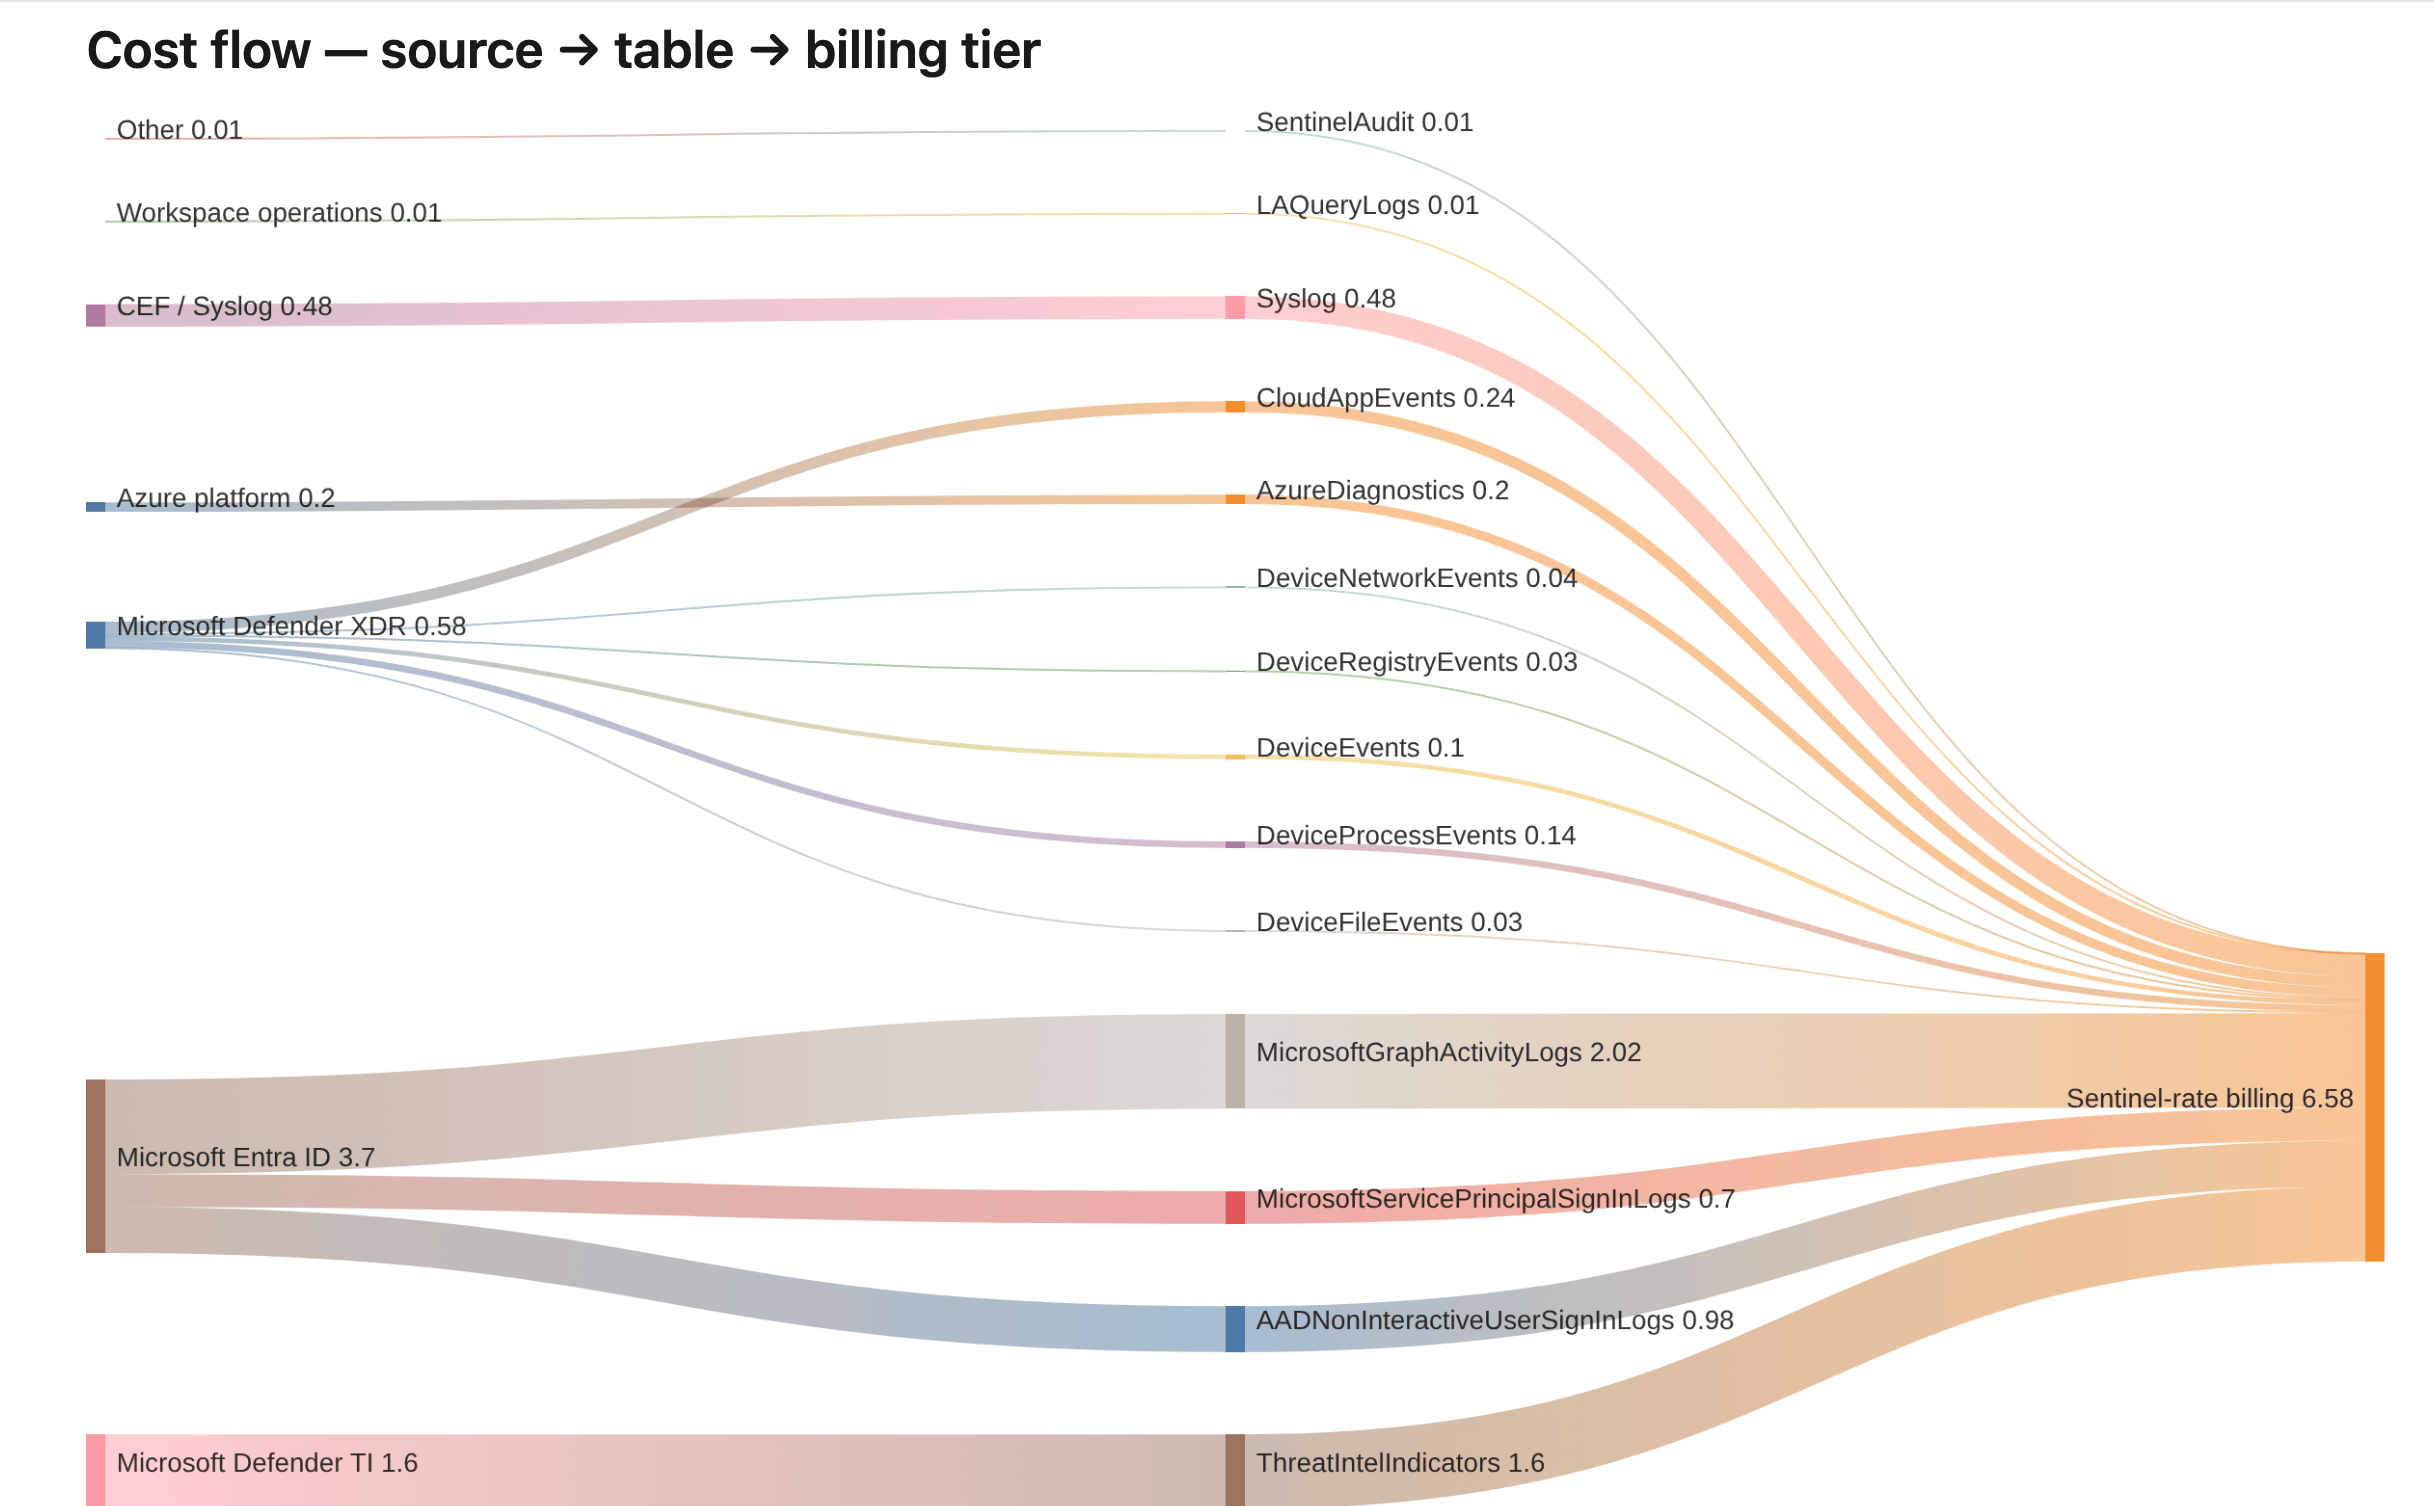
- Charts are baked in. Mermaid is pre-rendered to PNG so it survives Azure DevOps (which renders Mermaid about as enthusiastically as it renders sympathy), including a Sankey cost-flow over your cost-bearing tables.
- A hard privacy guard. The documentation is tenant config, so on a public repo the GitHub workflow fails rather than open a PR; the ADO pipeline pushes only to its private mirror.
There are no content adds in Wave 4. The catalogue is unchanged. This is a visibility release.
The detail follows. The operating guide lives at Docs/Operations/Sentinel-Documenter.md and the renderer internals at Docs/Operations/Documenter-Renderer-Design.md, so I'm linking rather than re-explaining.
Collector and renderer: two scripts, one boundary
Everything that makes this tool pleasant to live with comes from one decision: split capture from render, and never let them touch.
Scripts/Documenter/Export-SentinelInventory.ps1 is the collector. It connects to Azure, walks Sentinel, Log Analytics, the DCR and DCE layer, subscription context and recent usage, and writes a directory of JSON files to SecurityDocs/<workspace>/_raw/. Nothing it does mutates the tenant: the REST calls are GETs, and the handful of KQL and Resource Graph reads are queries, not writes. The Documenter looks but never touches, which is exactly the reassurance you want from something pointed at production. Almost everything goes through one GET-only REST helper, Private/Invoke-SentinelRest.ps1, because the surface the docs need (CCF connectors, Content Hub product packages, workspace settings, full DCR JSON with transforms) isn't covered by the Az cmdlets. KQL captures use Invoke-AzOperationalInsightsQuery; RBAC, subscription and policy context come from the Az.Resources cmdlets.
Scripts/Documenter/Convert-SentinelInventoryToMarkdown.ps1 is the renderer. It reads _raw/ and writes one Markdown section file per topic, plus an index.md. It touches Azure not at all. Same input, same output, every time. Boring, in the way good infrastructure is boring.
For an automation audience this boundary is the whole point:
- The expensive, non-deterministic step (Azure I/O) runs once. The cheap, deterministic step can re-run any number of times. Iterating on the document layout, or testing a new gap rule against last week's state, is a local loop with zero API calls.
- The Pester suite drives the renderer end-to-end with no auth. A deliberately broken fixture under Tests/Documenter/Fixtures/sample/_raw stands in for a real workspace, so the gap engine and the renderer are both fully testable offline. Those suites are picked up by the same PR-validation workflow Wave 3 shipped.
Module and API versions are pinned in Scripts/Documenter/Documenter.psd1. Both scripts honour the pins, the workflow cache key tracks them, and bumping a version is a one-line PR that re-runs the gate against the new surface.
The gap engine
A snapshot of your workspace is useful. A snapshot that quietly grades your workspace is better. The gap engine is the colleague who reads your config and points out, every morning and without ever getting bored of it, that the Log Analytics agent Microsoft retired back in 2024 is still cheerfully heartbeating into your workspace.
The findings on 90-gap-analysis.md come from small Test-* functions in Scripts/Documenter/Private/GapChecks.ps1, dispatched by Get-SentinelGap.ps1. Each rule is a row in best-practices.json:
{
  "id": "SENT-001",
  "title": "Daily cap not configured on the Log Analytics workspace",
  "category": "Cost",
  "severity": "Warning",
  "check": "Test-DailyCapConfigured",
  "remediation": "Set workspaceCapping.dailyQuotaGb to a sensible ceiling…",
  "learn": "https://learn.microsoft.com/azure/azure-monitor/logs/daily-cap"
}
Every check takes a single $Inventory parameter (the in-memory object built from _raw/) and returns $null on pass or a finding object on fail. The engine wires the rule metadata (severity, category, remediation, Learn link) around the result, and every SENT-NNN mention in the docs is hotlinked back to its full entry.
Adding a rule is the kind of change that should be small, and is:
- Write
Test-MyNewRuleinGapChecks.ps1. - Add a row to
best-practices.jsonreferencing it by name. - Add a fixture-driven assertion in Tests/Documenter/Get-SentinelGap.Tests.ps1.
That's the complete change. The JSON-plus-function pattern means the data drives the engine, not a switch block someone has to keep editing.
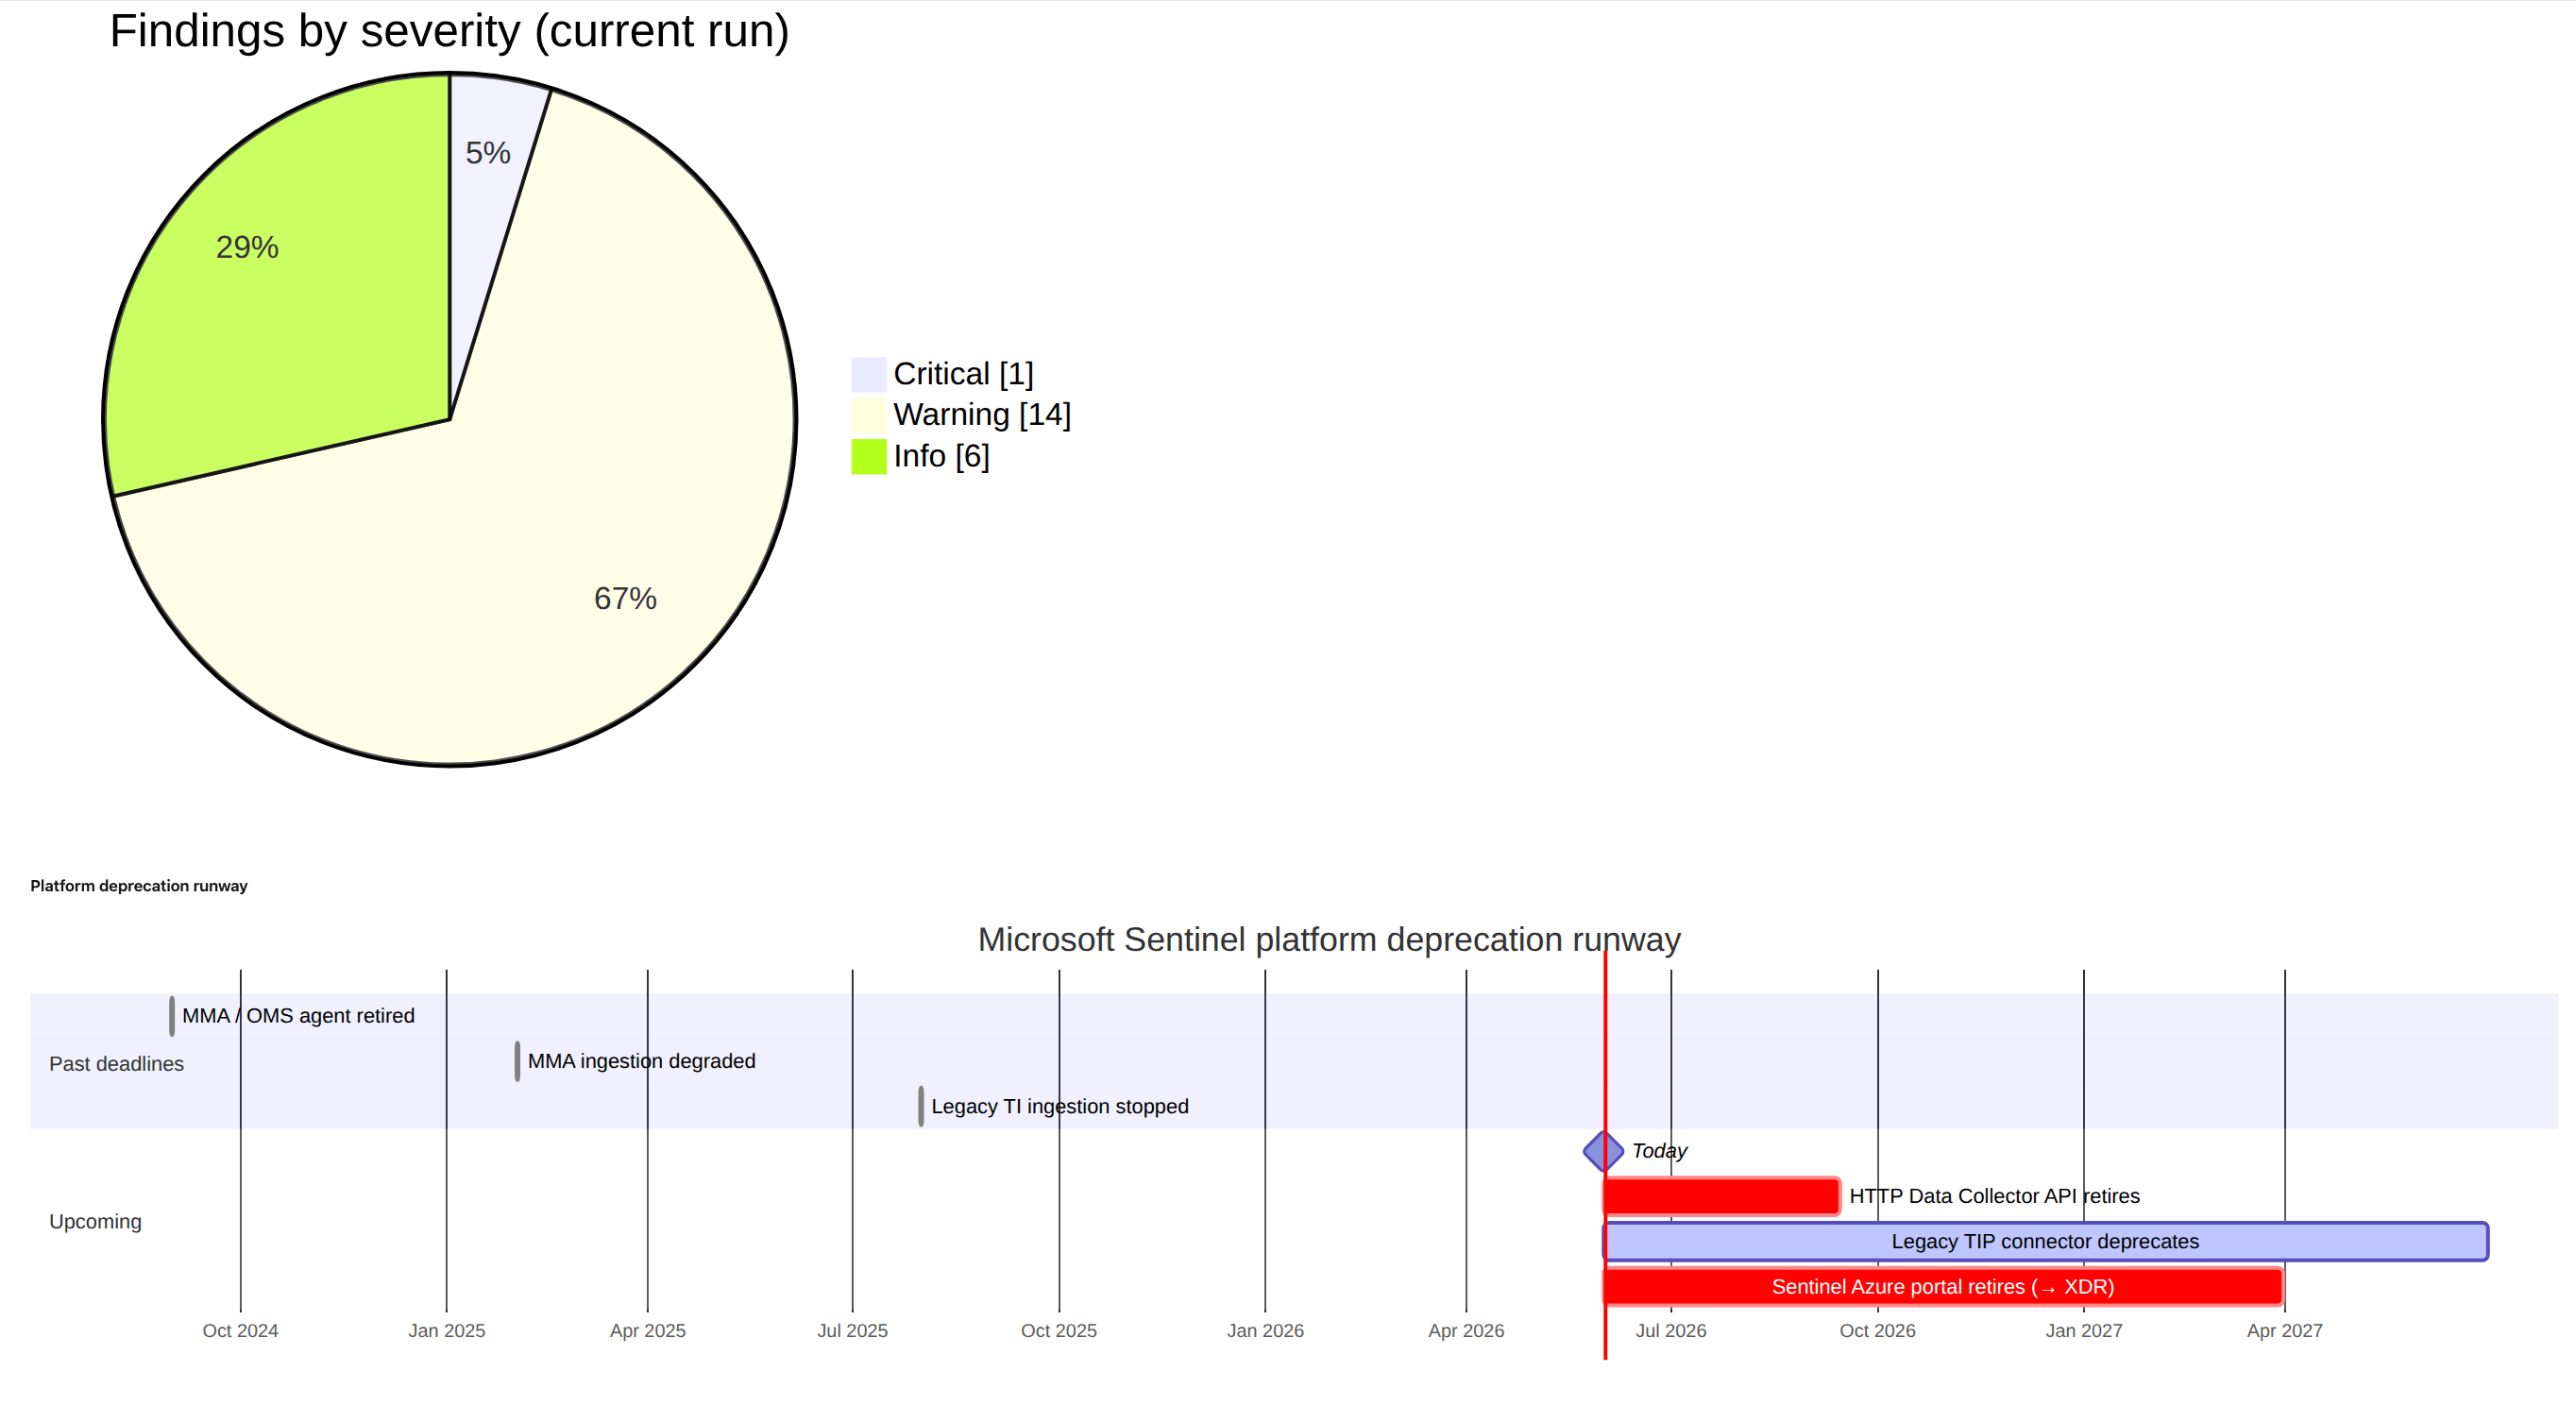
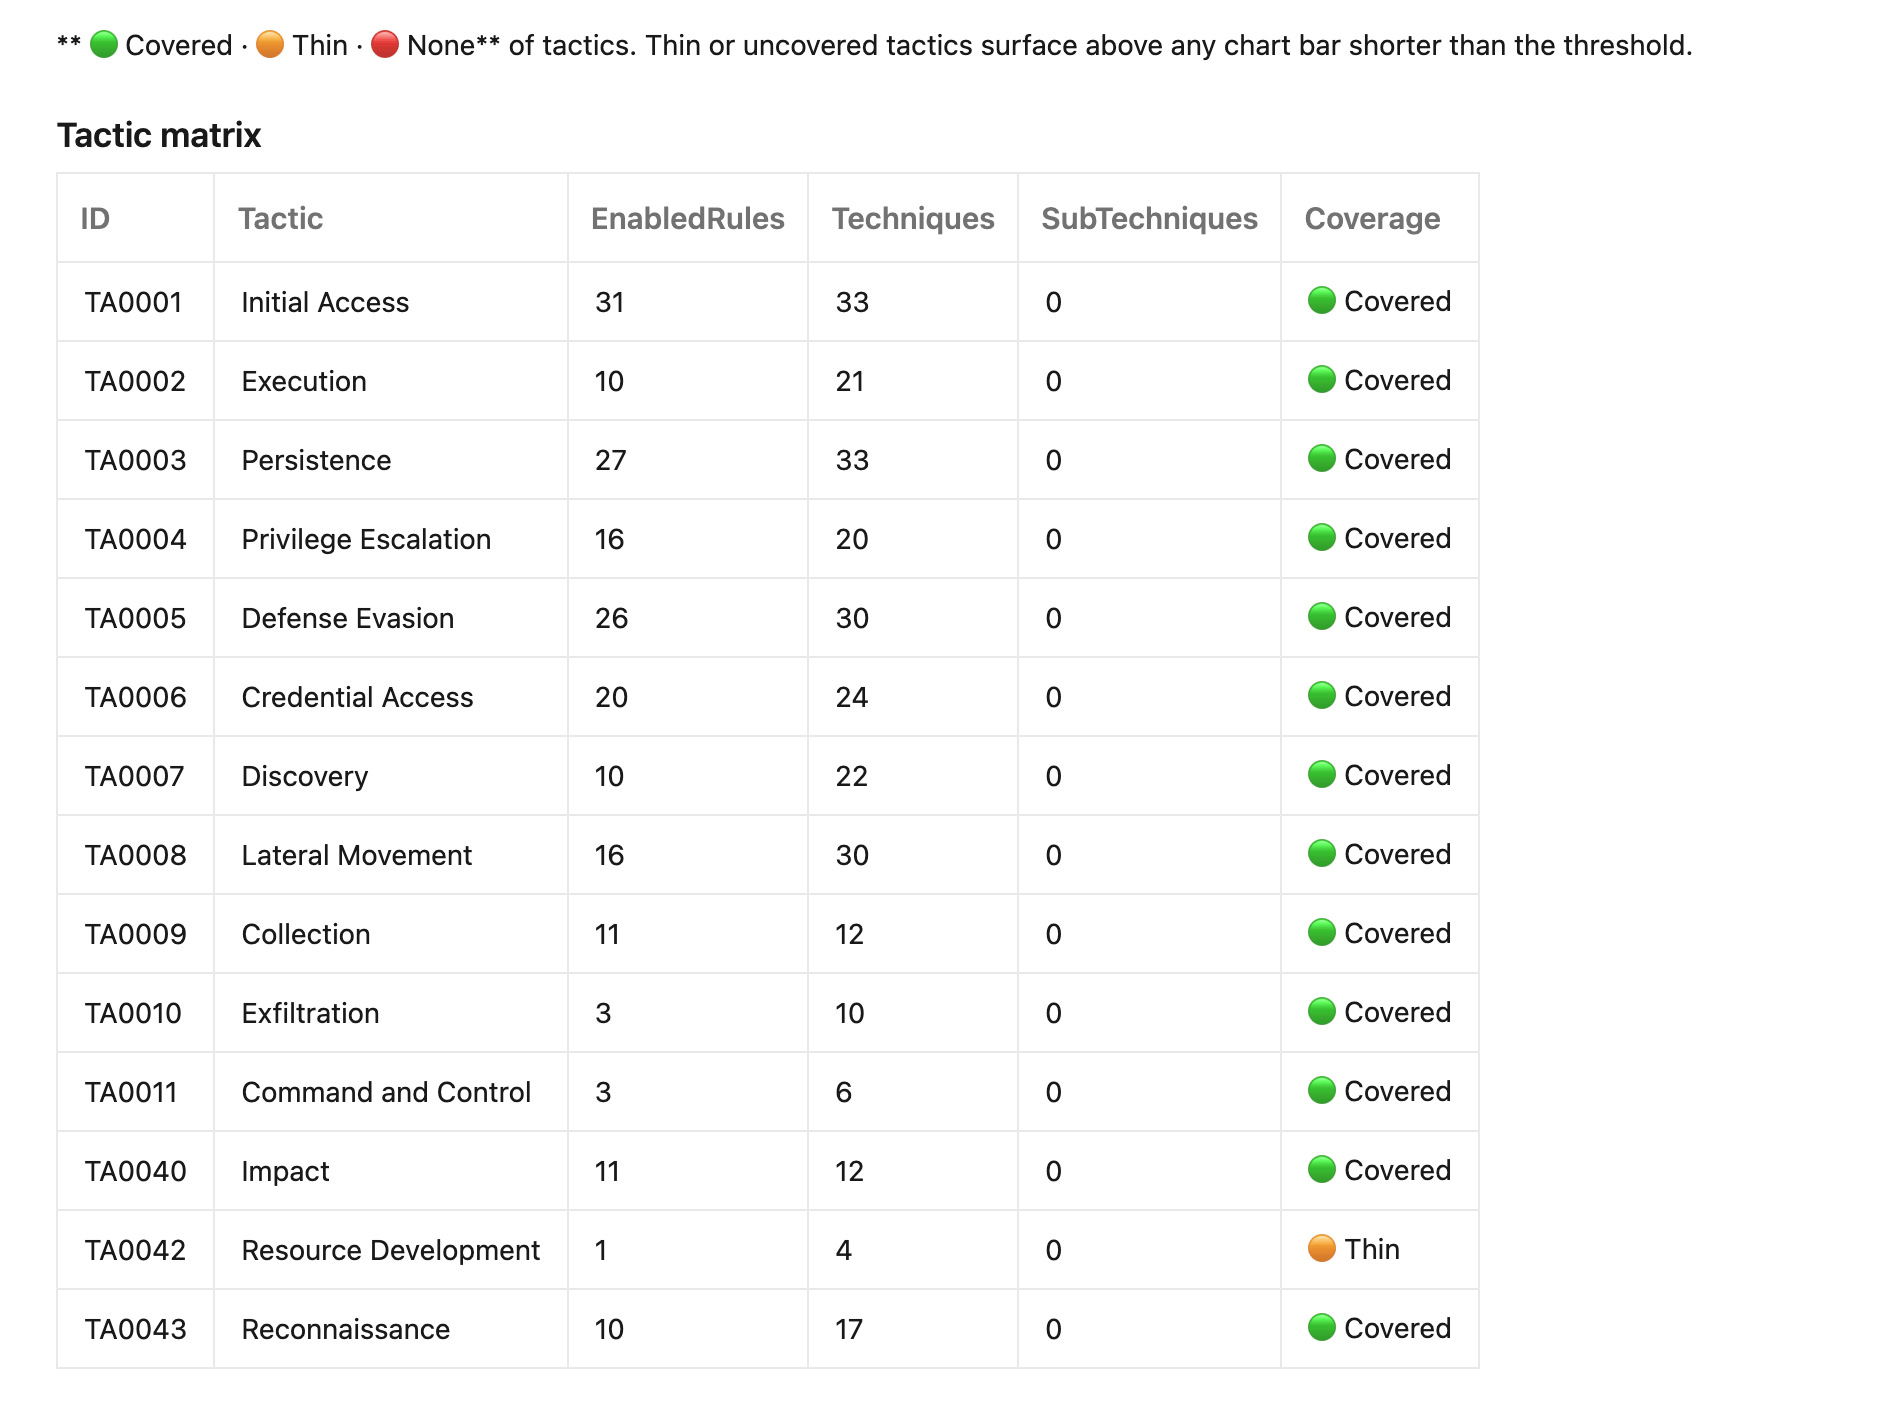
Wave 4's rule set leans hard into the things that actually bite: deprecation-deadline rules for the legacy HTTP Data Collector API (custom-logs v1), the Microsoft Monitoring Agent, and legacy threat-intel ingestion; cost rules (daily cap, retention overage, dedicated-cluster candidacy); coverage rules (MITRE tactics with no enabled detection at all, disabled or failing rules, orphan and silent tables). Categories (Cost, Coverage, Operational, Identity, Network, Resilience, Hygiene, Foundation, Strategic) are informational; severities are Critical, Warning and Info.
The cost estimator
Every Sentinel workspace has a monthly number nobody enjoys looking at directly. This is the section that looks at it for you, and, more usefully, shows its working so you can argue with it instead of just wincing.
84-cost-estimate.md is produced by Get-SentinelCostEstimate.ps1, and like everything else in the renderer it's pure data-in, data-out, so Pester can exercise it with fixtures.
The methodology, briefly (it's reproduced verbatim in the docs so a reader can trust or push back on the number):
- Per-table billable GB comes from the workspace
Usagetable (one cheap KQL query). - Plan attribution (
Analytics,Basic,Auxiliary,DataLake) decides which ingestion meter applies. - Unit prices are pulled from the public Azure Retail Prices API for the workspace's region. It's anonymous, with no auth, which keeps the estimator runnable from anywhere.
- Sentinel free-benefit-eligible tables have their unit price reduced or zeroed when the benefit applies.
- A commitment-tier what-if projects the monthly delta for each commitment rung the workspace's sustained ingest already qualifies for (only meaningful on
PerGB2018workspaces), using an illustrative discount it's upfront about. - A dedicated-cluster candidate flag trips when daily ingest is high enough to justify one. The gap engine pairs that with a check that no cluster is already linked.
It's deliberately honest about what it does not price: query-time billing for Basic and Auxiliary, search-job and restore storage, data-export egress, cross-region transfer, Defender XDR-side meters. It's a planning tool, not a billing tool, so if its number and the actual invoice ever disagree, believe the invoice. Sanity-check it against Cost Management once a quarter.
Charts that survive Azure DevOps
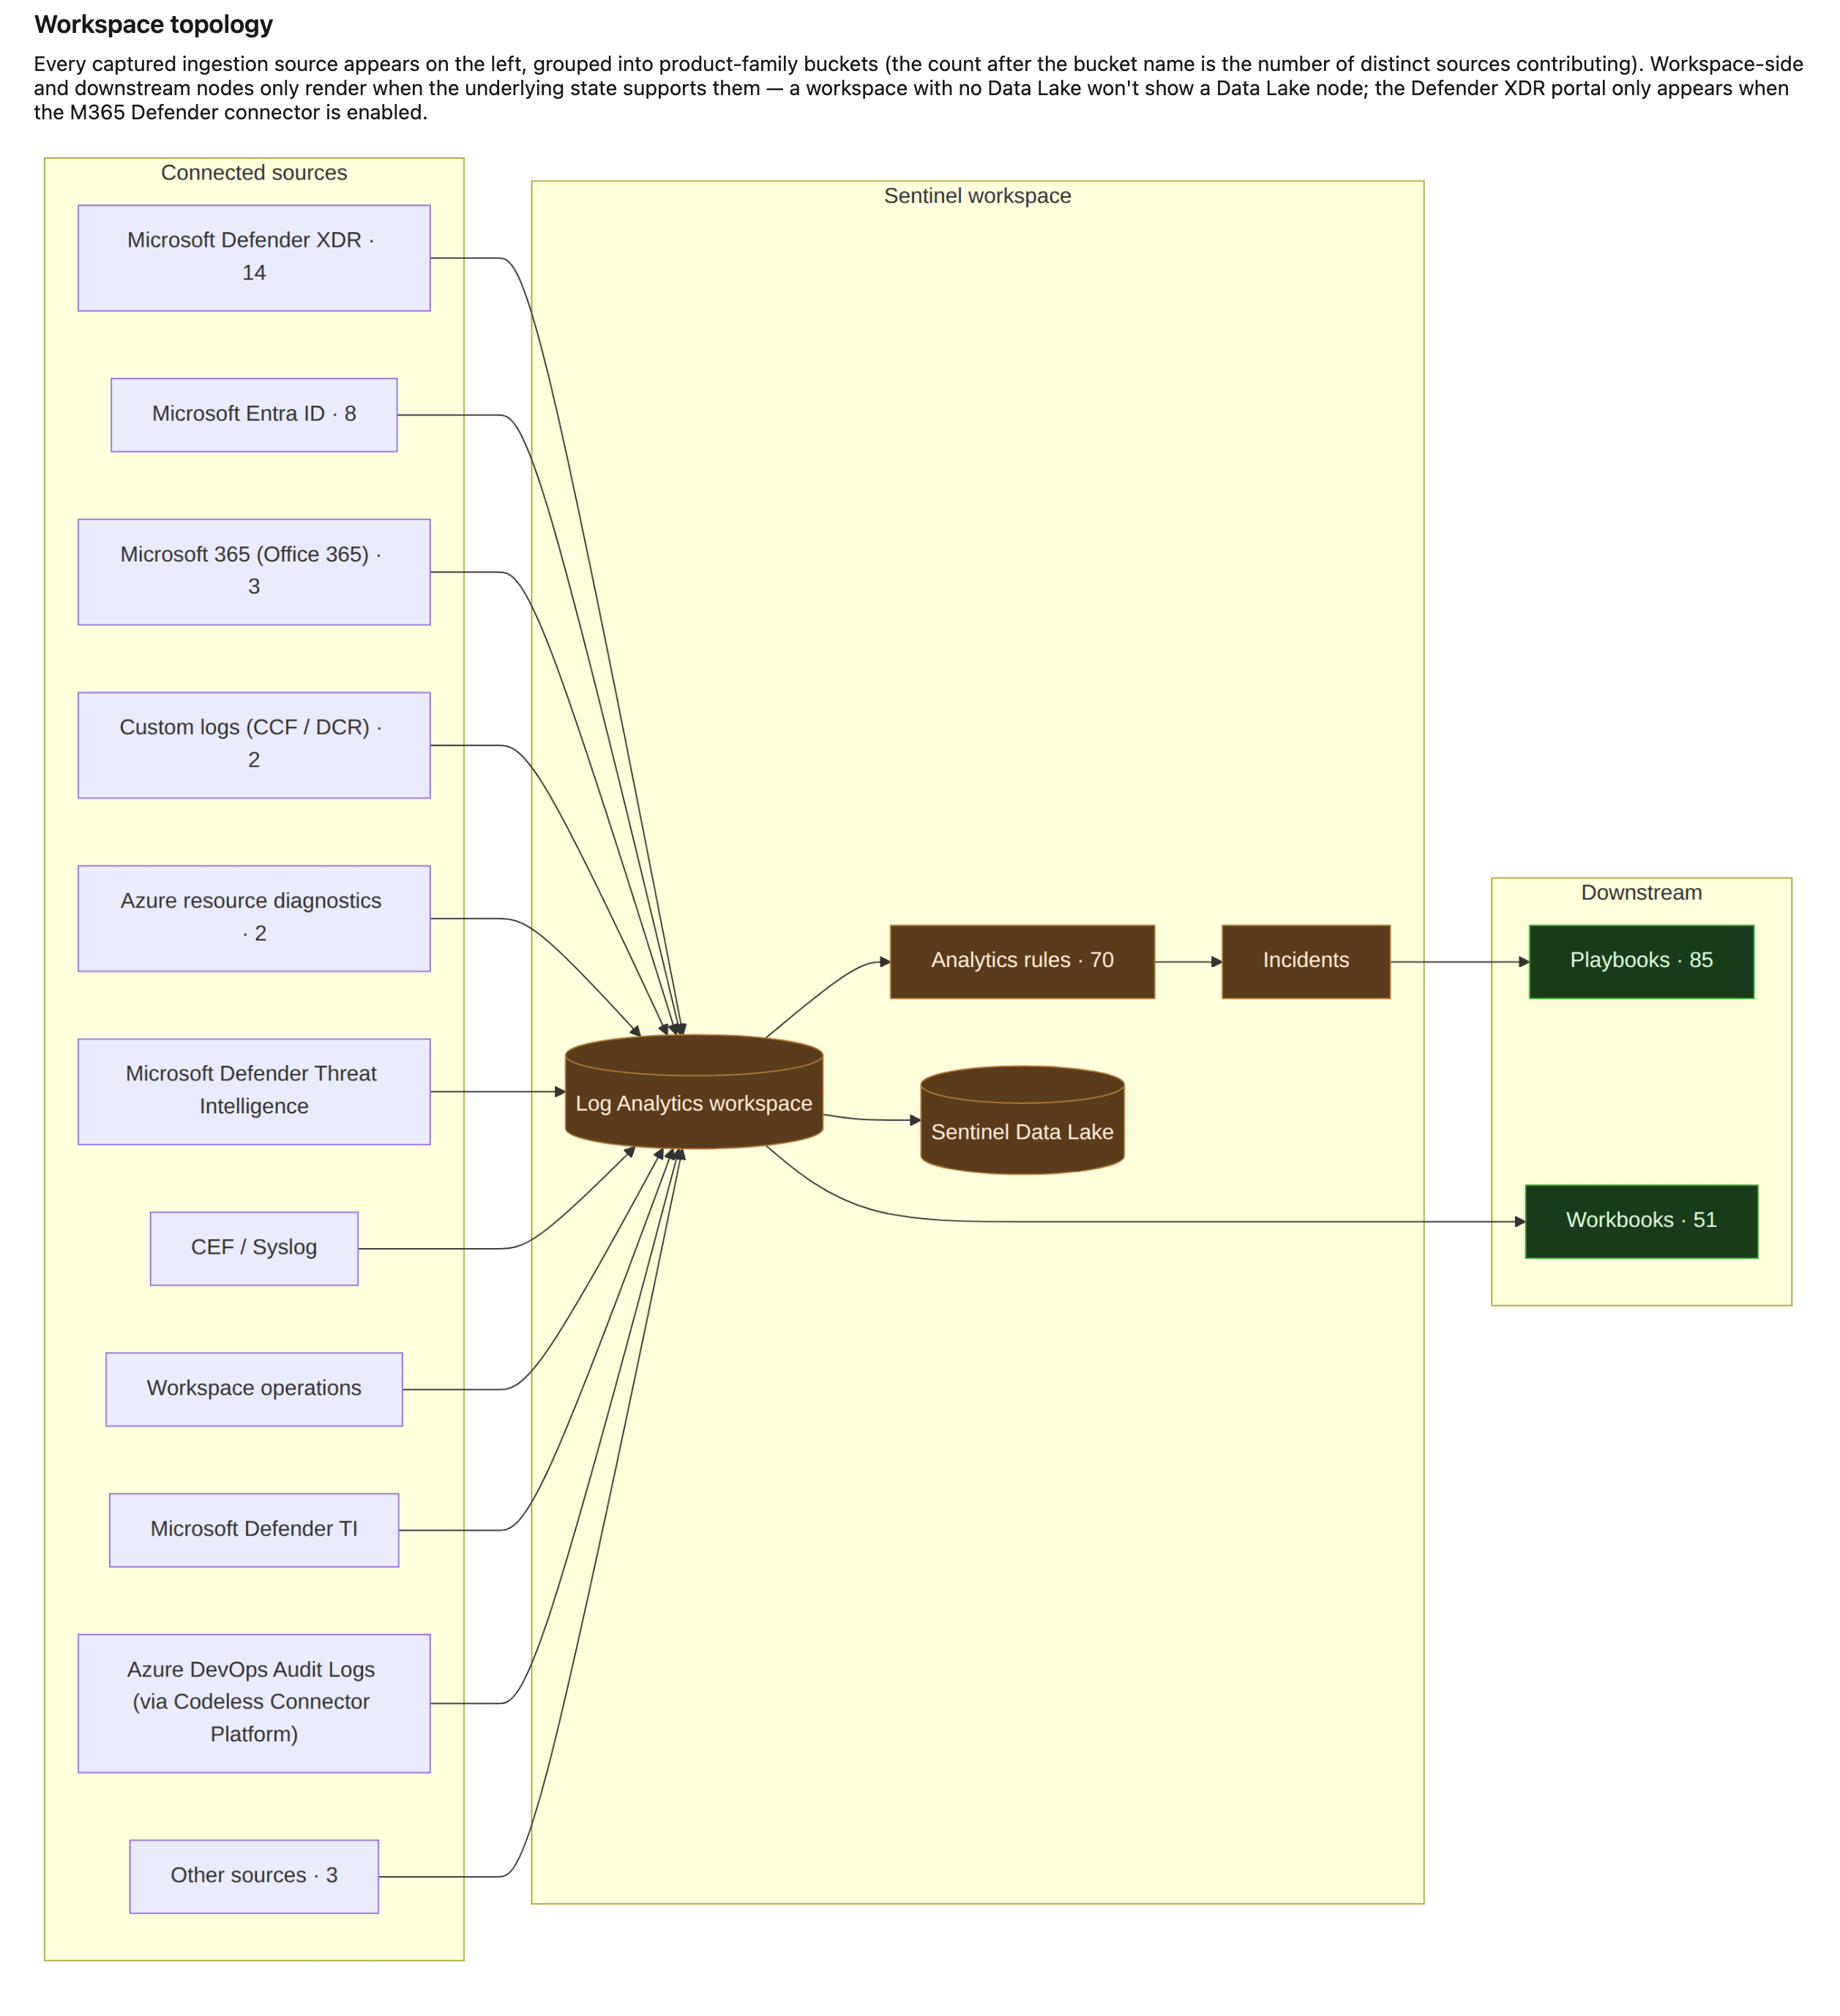
Documentation nobody opens is worthless, so the rendered output got real (and occasionally undignified) effort. This is the fun part. It isn't a wall of grey tables: nearly every section opens with a chart. Topology diagrams, a MITRE coverage matrix, table-cost bars, and a glorious Sankey cost-flow that fans your monthly spend out across the tables that actually move the number (the trivially-cheap long tail gets rolled into per-source buckets so a busy workspace stays readable), letting you see where the money goes at a glance.
This is where it got silly. GitHub renders Mermaid in Markdown natively. Azure DevOps does not, and if you hand it an SVG instead it refuses outright, sanitising the image into a broken-icon placeholder on the suspicion that an SVG might be up to something. So for the ADO side the renderer pre-renders each Mermaid block to PNG via Convert-MermaidToImage.ps1, gated behind a pipeline toggle, while GitHub keeps the native fences. PNG, ADO can live with.
Getting the charts to actually fit took more fiddling than it should have. For a while every title was missing its first few letters, sliding off the left edge like it was trying to leave, because the chart tool sized the canvas to the chart and ignored the title hanging over the top of it. The pre-render now sizes each image to its full content, titles included. A good chunk of this wave's commit history is exactly this sort of unglamorous chart-wrangling (clipped labels, parentheses breaking the parser, axis labels too long) because a chart that almost renders is worse than no chart at all.
Effective connectors: the synthesised view
One for anyone who's tried to inventory a workspace from the API. Ask Sentinel's dataConnectors and dataConnectorDefinitions endpoints what's feeding your workspace and you get an answer that's confident and only partly true: they enumerate connectors registered against the Sentinel resource provider, and nothing else. A modern workspace pulls most of its data through DCRs and diagnostic-settings pipelines that never show up there, so a naïve "section 10" makes a well-instrumented workspace look like a ghost town.
Get-EffectiveConnectors.ps1 synthesises a unified ingestion view by walking the sources in precedence order: Classic, CCF, DCR output streams, diagnostic-settings categories, and finally any active table with billable data that no earlier source explained. That last row is a deliberate visibility signal. A table receiving data that no captured mechanism accounts for usually means a path the documenter doesn't yet enumerate, such as a Logic App outside the captured RG, or a legacy MMA agent still attached. You want to know about it.
Privacy guard and topology
The documentation is a folder of detailed tenant configuration: workspace IDs, table names, rule logic, RBAC principals, cost figures, network ACLs. Which is to say, precisely the material you never want trending on a public repo. It must not land in one, and the pipeline treats that as non-negotiable rather than something to remember on a good day.
Both pipelines guard against this. On a public repo the GitHub Actions workflow (.github/workflows/sentinel-document.yml) fails the whole run rather than open a PR, and since a PR is requested by default (including on the scheduled run), a public repo gets nothing from the daily job at all. To get the docs out of a public repo you trigger it by hand with the PR step turned off, and it delivers the artefact only. The ADO pipeline relies on ADO repos being private by default and pushes only to its private mirror. On a private repo each run delivers through two channels: a downloadable pipeline artefact and a review-only PR from a rolling per-workspace branch, carrying a "do not merge" banner because merging it would commit tenant config permanently.
This repo runs topology B: public GitHub source-of-truth, private ADO mirror. The ADO pipeline opens PRs in the private mirror; the GitHub workflow's PR step refuses to run on the public copy. If your source lives in a single private repo, topology A is simpler, and the workflow opens the PR right there.
Auth is least-privilege and separate from the deploy SP. GitHub OIDC federates to an Entra credential, which maps to a read-only service principal (AZURE_DOCUMENTER_CLIENT_ID) holding Microsoft Sentinel Reader and Log Analytics Reader at the workspace, Reader on the playbook and DCR resource groups, and Monitoring Reader plus Reader at the subscription. The full role and scope table, and every API version, module pin and Learn reference the tool depends on, are in Scripts/Documenter/REFERENCES.md.
Running it locally
The collector and renderer are just scripts, with no pipeline required:
# Connect with an account holding the read-only roles.
Connect-AzAccount

# Collect to ./SecurityDocs/<workspace>/_raw/
./Scripts/Documenter/Export-SentinelInventory.ps1 `
    -SubscriptionId 'sub-guid' `
    -ResourceGroup  'rg-sentinel-prod' `
    -WorkspaceName  'law-sentinel-prod' `
    -IncludePreview

# Render to ./SecurityDocs/<workspace>/*.md
./Scripts/Documenter/Convert-SentinelInventoryToMarkdown.ps1 `
    -WorkspaceName 'law-sentinel-prod'
Then open SecurityDocs/<workspace>/index.md. Because the renderer is offline and always produces the same output from the same input, you can keep re-running the render step against the same _raw/ while you iterate. Sovereign clouds work without any URL substitution, because Invoke-AzRestMethod routes to the audience of the active context, so Connect-AzAccount -Environment AzureUsGovernment before the collector is the only change.
What this tool is not
Honest scope, same as the doc:
- Not a real-time monitor. SentinelHealth,
LAQueryLogsand Azure Monitor alerts do that. - Not a billing tool. It estimates; Cost Management is the source of truth.
- Not a deployer. It only reads. Deployment stays with the
Deploy-*.ps1family. - Not multi-workspace yet. The script is parameterised, but the workflow runs against a single workspace. A matrix strategy is a follow-up.
It's the read-only sibling of Wave 3's drift detector. Test-SentinelRuleDrift.ps1 answers "is what's deployed what's in the repo?" The Documenter answers the prior question: "what's deployed, and is it any good?"
And the part the whole wave was built around: tomorrow morning it does all of it again (the inventory, the costing, the grading, the charts) and you still won't have written a word.
Full operating guide: Docs/Operations/Sentinel-Documenter.md. Renderer internals and how to add a chart: Docs/Operations/Documenter-Renderer-Design.md.

If you've enjoyed this content and would like to support more like it, please consider subscribing. Your support helps me continue creating practical security automation content for the community.