Integrating UniFi Network Monitoring into Microsoft Sentinel

If you're running a UniFi network and using Microsoft Sentinel for security operations, you've likely wondered how to bring your network infrastructure data into your SIEM. Until recently, this required custom solutions or third-party tools. With the release of the official UniFi Site Manager API, we can now build a proper integration using Microsoft Sentinel's Codeless Connector Framework (CCF).
In this post, I'll walk you through deploying a set of custom connectors that ingest UniFi network data directly into Microsoft Sentinel, enabling security monitoring, alerting, and investigation capabilities for your UniFi infrastructure.
Why Monitor UniFi in Sentinel?
UniFi networks are increasingly common in both home and enterprise environments. From Dream Machines to Cloud Keys, access points to switches, these devices form critical infrastructure that security teams need visibility into.
By bringing UniFi data into Sentinel, you can:
- Detect device anomalies - Alert when devices go offline unexpectedly or exhibit unusual behaviour
- Track firmware compliance - Identify devices running outdated firmware that may have security vulnerabilities
- Monitor ISP performance - Correlate network performance issues with security incidents
- Audit network changes - Track when new devices are adopted or configurations change
- Centralise visibility - View network infrastructure alongside other security data sources
Understanding the UniFi Site Manager API
Ubiquiti introduced the Site Manager API to provide programmatic access to UniFi deployments. This official API replaces the need for unofficial controller APIs and provides a consistent interface regardless of your controller type.
The API offers several endpoints:
| Endpoint | Description |
|---|---|
/v1/hosts | UniFi consoles and controllers |
/v1/sites | Network sites and their statistics |
/v1/devices | Network devices (APs, switches, gateways) |
/ea/isp-metrics/{interval} | ISP performance metrics |
The API uses a simple API key authentication model. Keys are created at unifi.ui.com and provide read-only access to all hosts and sites associated with your UI account.
Rate Limits
The API has generous rate limits for production use:
- v1 stable endpoints: 10,000 requests per minute
- Early Access endpoints: 100 requests per minute
The ISP metrics endpoint (/ea/) is currently in Early Access, meaning the endpoint structure may change in future releases.
The Connector Architecture
Rather than creating a single monolithic connector, I've built four separate connectors—one for each API endpoint. This modular approach offers several advantages:
- Flexibility - Deploy only the data types you need
- Independent polling - Configure different intervals for each data type
- Easier troubleshooting - Isolate issues to specific connectors
- Reduced costs - Don't ingest data you won't use
Each connector creates its own:
- Custom log table (e.g.,
UniFiSiteManager_Devices_CL) - Data Collection Rule (DCR)
- RestApiPoller data connector
Data Tables
| Table | Description | Recommended Polling |
|---|---|---|
UniFiSiteManager_Hosts_CL | Console/controller inventory | 5 minutes |
UniFiSiteManager_Sites_CL | Site configurations and statistics | 5 minutes |
UniFiSiteManager_Devices_CL | Device inventory and status | 5 minutes |
UniFiSiteManager_ISPMetrics_CL | Internet performance metrics | 60 minutes |
Prerequisites
Before deploying the connectors, ensure you have:
- Microsoft Sentinel workspace with Contributor permissions
- Data Collection Endpoint (DCE) in your resource group
- UniFi Site Manager API key from unifi.ui.com
Creating a Data Collection Endpoint
If you don't already have a DCE, create one in the Azure Portal:
- Navigate to Monitor > Data Collection Endpoints
- Click Create
- Enter a name (e.g.,
sentinel-unifi-dce) - Select your subscription and resource group
- Choose the same region as your Sentinel workspace
- Click Review + create
Obtaining Your UniFi API Key
- Sign in to UniFi Site Manager
- Click API in the left navigation
- Click Create API Key
- Copy the key immediately—it's only displayed once
Important: Store your API key securely. It provides access to all hosts and sites associated with your UI account.
Deployment
Setting Up the Data Collection Endpoint
Before deploying any of the UniFi connectors, you must have a Data Collection Endpoint (DCE) in place. The DCE is a critical component of Azure Monitor's data ingestion pipeline—it's the entry point that receives data from the connector and routes it to your Log Analytics workspace.
What is a Data Collection Endpoint?
A Data Collection Endpoint provides a dedicated ingestion URL for your data. When the UniFi connector polls the Site Manager API, it sends the retrieved data to the DCE, which then:
- Receives the incoming data over HTTPS
- Applies any transformations defined in the Data Collection Rule (DCR)
- Routes the transformed data to your Log Analytics workspace
Each DCE can serve multiple data connectors and Data Collection Rules, so you likely only need one per region.
Creating a Data Collection Endpoint
Option 1: Azure Portal
- Navigate to the Azure Portal
- Search for Data Collection Endpoints in the search bar
- Click Create
- Configure the basics:
- Subscription: Select your subscription
- Resource Group: Choose the same resource group as your Sentinel workspace
- Name: Enter a descriptive name (e.g.,
dce-sentinel-unifi-uksouth) - Region: Select the same region as your Log Analytics workspace (this is important!)
- Click Review + create
- Click Create
Important: The DCE must be in the same region as your Log Analytics workspace. Cross-region data collection is not supported.
Option 2: Azure CLI
# Set your variables
SUBSCRIPTION="your-subscription-id"
RESOURCE_GROUP="your-resource-group"
LOCATION="uksouth"
DCE_NAME="dce-sentinel-unifi-uksouth"

# Create the Data Collection Endpoint
az monitor data-collection endpoint create \
  --name $DCE_NAME \
  --resource-group $RESOURCE_GROUP \
  --location $LOCATION \
  --public-network-access "Enabled"
Option 3: PowerShell
# Set your variables
$resourceGroup = "your-resource-group"
$location = "uksouth"
$dceName = "dce-sentinel-unifi-uksouth"

# Create the Data Collection Endpoint
New-AzDataCollectionEndpoint `
    -Name $dceName `
    -ResourceGroupName $resourceGroup `
    -Location $location `
    -NetworkAclsPublicNetworkAccess "Enabled"
Option 4: ARM Template
If you prefer infrastructure as code, you can deploy the DCE using an ARM template:
{
    "$schema": "https://schema.management.azure.com/schemas/2019-04-01/deploymentTemplate.json#",
    "contentVersion": "1.0.0.0",
    "parameters": {
        "dataCollectionEndpointName": {
            "type": "string",
            "metadata": {
                "description": "Name of the Data Collection Endpoint"
            }
        },
        "location": {
            "type": "string",
            "defaultValue": "[resourceGroup().location]",
            "metadata": {
                "description": "Location must match your Log Analytics workspace region"
            }
        }
    },
    "resources": [
        {
            "type": "Microsoft.Insights/dataCollectionEndpoints",
            "apiVersion": "2022-06-01",
            "name": "[parameters('dataCollectionEndpointName')]",
            "location": "[parameters('location')]",
            "properties": {
                "networkAcls": {
                    "publicNetworkAccess": "Enabled"
                }
            }
        }
    ],
    "outputs": {
        "dataCollectionEndpointId": {
            "type": "string",
            "value": "[resourceId('Microsoft.Insights/dataCollectionEndpoints', parameters('dataCollectionEndpointName'))]"
        }
    }
}
Verifying Your DCE
After creation, verify the DCE is ready:
- Navigate to Monitor > Data Collection Endpoints
- Click on your newly created DCE
- Check that the Provisioning State shows Succeeded
- Note the Logs Ingestion endpoint URL—this confirms the DCE is operational
Naming Conventions
I recommend using a consistent naming convention for your DCEs. Some examples:
| Pattern | Example |
|---|---|
dce-{purpose}-{region} | dce-sentinel-unifi-uksouth |
{environment}-dce-{purpose} | prod-dce-unifi-connector |
dce-{workspace}-{region} | dce-sentinel-prod-uksouth |
Network Considerations
By default, DCEs are created with public network access enabled. If your organisation requires private connectivity:
- Create the DCE with public access disabled
- Configure a Private Link scope
- Create private endpoints for the DCE
- Ensure your data sources can reach the private endpoint
For the UniFi connector specifically, public access is typically fine as the connector runs within Azure's infrastructure and communicates with the DCE over Azure's backbone network.
Common Issues
"Data Collection Endpoint not found"
Ensure the DCE name in your connector deployment exactly matches the DCE you created. The parameter is case-sensitive.
"Region mismatch"
The DCE must be in the same region as your Log Analytics workspace. If you see ingestion failures, verify both resources are in the same Azure region.
"Insufficient permissions"
Creating a DCE requires the Monitoring Contributor role or equivalent permissions on the resource group.
The connectors are deployed as ARM templates. You have several options:
Option 1: Deploy to Azure Button
The quickest method is using the Deploy to Azure buttons. Click the button for each connector you wish to deploy:
| Connector | Deploy |
|---|---|
| Devices | |
| Hosts | |
| Sites | |
| ISP Metrics |
Understanding the Deployment Parameters
When you deploy a UniFi connector using the ARM template, you'll be presented with a configuration form in the Azure Portal. Let's walk through each parameter and what it means.
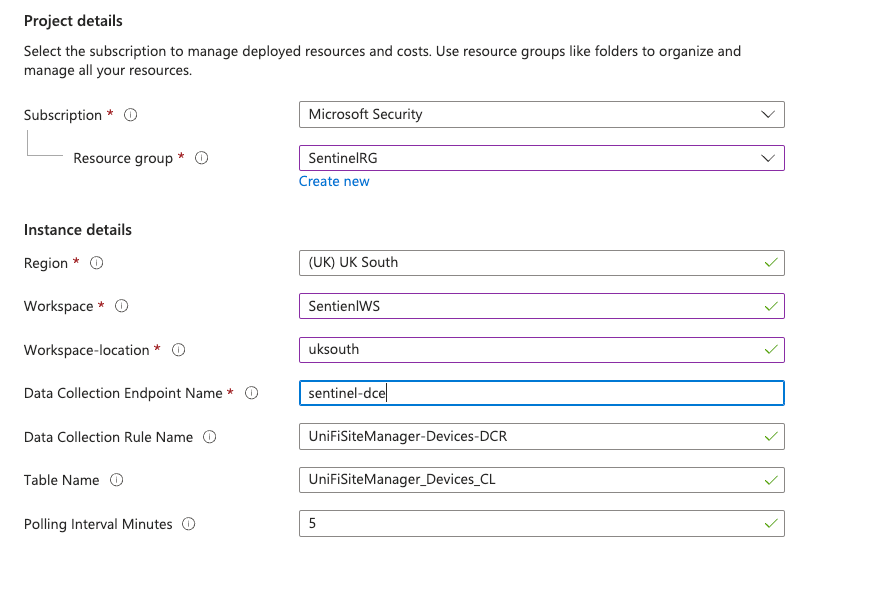
Parameter Guidelines
Workspace and Workspace-location
These two parameters must match your existing Log Analytics workspace exactly:
- Workspace is the display name you see in the Azure Portal
- Workspace-location is the region code (e.g.,
uksouth,eastus,westeurope)
Data Collection Endpoint Name
This must reference a DCE that already exists. The deployment will fail if:
- The DCE doesn't exist
- The DCE is in a different resource group
- The DCE is in a different region to your workspace
Tip: You can find your DCE name by navigating to Monitor > Data Collection Endpoints in the Azure Portal.
Option 2: Azure CLI
For automated deployments or CI/CD pipelines:
# Clone the repository
git clone https://github.com/noodlemctwoodle/sentinel.blog.git
cd sentinel.blog/MicrosoftSentinel/CodelessConnectorFramework/Unifi

# Set your variables
RG="your-resource-group"
WORKSPACE="your-sentinel-workspace"
LOCATION="uksouth"
DCE_NAME="your-dce-name"

# Deploy Devices connector
az deployment group create \
  --resource-group $RG \
  --template-file azuredeploy_devices.json \
  --parameters \
    workspace=$WORKSPACE \
    workspace-location=$LOCATION \
    dataCollectionEndpointName=$DCE_NAME

# Deploy remaining connectors...
Option 3: PowerShell
# Clone the repository
git clone https://github.com/noodlemctwoodle/sentinel.blog.git
Set-Location sentinel.blog/MicrosoftSentinel/CodelessConnectorFramework/Unifi

# Common parameters
$params = @{
    ResourceGroupName = "your-resource-group"
    workspace = "your-sentinel-workspace"
    "workspace-location" = "uksouth"
    dataCollectionEndpointName = "your-dce-name"
}

# Deploy all connectors
New-AzResourceGroupDeployment @params -TemplateFile "azuredeploy_devices.json"
New-AzResourceGroupDeployment @params -TemplateFile "azuredeploy_hosts.json"
New-AzResourceGroupDeployment @params -TemplateFile "azuredeploy_sites.json"
New-AzResourceGroupDeployment @params -TemplateFile "azuredeploy_isp_metrics.json" `
    -metricInterval "1h" -pollingIntervalMinutes 60
Deployment Parameters
All connectors accept these parameters:
| Parameter | Required | Description |
|---|---|---|
workspace | Yes | Log Analytics workspace name |
workspace-location | Yes | Workspace region (e.g., uksouth) |
dataCollectionEndpointName | Yes | Your existing DCE name |
dataCollectionRuleName | No | Custom DCR name |
tableName | No | Custom table name |
pollingIntervalMinutes | No | Polling frequency |
The ISP Metrics connector has an additional metricInterval parameter to choose between 5m (Early Access) and 1h (stable) aggregation periods.
Post-Deployment Configuration
After deploying the ARM templates, you need to connect each data connector:
- Navigate to Microsoft Sentinel > Data connectors
- Search for "UniFi Site Manager"
- Click on each connector to open its page
- Click Open connector page
- Enter your UniFi API key
- Click Connect
Data should begin appearing within 30 minutes of connection.
Working with the Data
Understanding the Schema
Each table has a specific schema designed to capture the relevant data from the API. Some tables include nested dynamic fields that require special handling in KQL.
Devices Table
The devices table is the most straightforward:
UniFiSiteManager_Devices_CL
| project
    TimeGenerated,
    name,
    model,
    ip,
    mac,
    status,
    version,
    productLine
| take 100
Sites Table
Sites contain nested metadata and statistics:
UniFiSiteManager_Sites_CL
| extend
    siteName = tostring(meta.name),
    timezone = tostring(meta.timezone),
    totalDevices = toint(siteStatistics.counts.totalDevice),
    offlineDevices = toint(siteStatistics.counts.offlineDevice),
    wifiClients = toint(siteStatistics.counts.wifiClient)
| project TimeGenerated, siteName, totalDevices, offlineDevices, wifiClients
ISP Metrics Table
ISP metrics require expanding the periods array:
UniFiSiteManager_ISPMetrics_CL
| mv-expand period = periods
| extend
    metricTime = todatetime(period.metricTime),
    avgLatency = toint(period.data.wan.avgLatency),
    maxLatency = toint(period.data.wan.maxLatency),
    packetLoss = toint(period.data.wan.packetLoss),
    downloadMbps = todouble(period.data.wan.download_kbps) / 1000,
    uploadMbps = todouble(period.data.wan.upload_kbps) / 1000,
    uptime = toint(period.data.wan.uptime),
    downtime = toint(period.data.wan.downtime),
    ispName = tostring(period.data.wan.ispName),
    ispAsn = tostring(period.data.wan.ispAsn),
    firmwareVersion = tostring(period.version)
| project
    TimeGenerated,
    metricTime,
    siteId,
    hostId,
    metricType,
    ispName,
    ispAsn,
    avgLatency,
    maxLatency,
    packetLoss,
    downloadMbps,
    uploadMbps,
    uptime,
    downtime,
    firmwareVersion
Useful Queries
Here are some queries I use regularly:
Device Inventory Overview
UniFiSiteManager_Devices_CL
| summarize
    TotalDevices = dcount(id),
    OnlineDevices = dcountif(id, status == "online"),
    OfflineDevices = dcountif(id, status != "online")
    by productLine
| extend OfflinePercentage = round(100.0 * OfflineDevices / TotalDevices, 2)
Devices Needing Firmware Updates
UniFiSiteManager_Devices_CL
| where isnotempty(updateAvailable)
| summarize arg_max(TimeGenerated, *) by id
| project name, model, version, updateAvailable, firmwareStatus
| sort by name asc
ISP Performance Summary
UniFiSiteManager_ISPMetrics_CL
| mv-expand period = periods
| extend
    avgLatency = toint(period.data.wan.avgLatency),
    packetLoss = toint(period.data.wan.packetLoss),
    uptime = toint(period.data.wan.uptime)
| summarize
    AvgLatency = avg(avgLatency),
    MaxLatency = max(avgLatency),
    AvgPacketLoss = avg(packetLoss),
    AvgUptime = avg(uptime)
    by siteId
| extend UptimeSLA = iff(AvgUptime >= 99.9, "✅ Met", "❌ Not Met")
Creating Analytics Rules
With the data flowing into Sentinel, you can create analytics rules to detect issues automatically.
Device Offline Alert
UniFiSiteManager_Devices_CL
| where TimeGenerated > ago(10m)
| where status != "online"
| project
    TimeGenerated,
    name,
    model,
    ip,
    mac,
    productLine
Configure this rule to run every 5 minutes with a 10-minute lookback.
High Packet Loss Detection
UniFiSiteManager_ISPMetrics_CL
| where TimeGenerated > ago(20m)
| mv-expand period = periods
| extend packetLoss = toint(period.data.wan.packetLoss)
| where packetLoss > 5
| project TimeGenerated, siteId, packetLoss
Run every 15 minutes to detect sustained packet loss issues.
Firmware Compliance Report
UniFiSiteManager_Devices_CL
| where TimeGenerated > ago(1d)
| where isnotempty(updateAvailable)
| summarize arg_max(TimeGenerated, *) by id
| summarize
    DevicesNeedingUpdates = count(),
    Devices = make_list(name)
Schedule this as a daily summary for your security team.
Building Workbooks
For visual dashboards, create a Sentinel workbook combining the UniFi data:
- Navigate to Microsoft Sentinel > Workbooks
- Click Add workbook
- Add query tiles for:
- Device status overview (pie chart)
- Offline devices (table)
- ISP latency trends (time chart)
- Firmware compliance (bar chart)
A sample workbook query for device status:
UniFiSiteManager_Devices_CL
| summarize arg_max(TimeGenerated, *) by id
| summarize Count = count() by status
| render piechart
Troubleshooting
No Data Appearing
- Check API key - Verify the key is correct in the connector configuration
- Verify DCE - Ensure the Data Collection Endpoint is running
- Check DCR - Review the Data Collection Rule in Azure Monitor for errors
- Wait - Initial ingestion can take up to 30 minutes
Rate Limiting
If you see 429 errors in the logs:
- Increase
pollingIntervalMinutesto reduce request frequency - For ISP Metrics, use the
1hinterval instead of5m - Check if you have multiple services using the same API key
Missing Fields
The UniFi API response structure varies by UniFi OS version. Always use isnotempty() checks when querying optional fields:
UniFiSiteManager_Devices_CL
| where isnotempty(updateAvailable)
Cost Considerations
Log Analytics charges based on data ingestion volume. To estimate costs:
- Deploy the connectors with a short retention period initially
- Monitor the Usage blade in your Log Analytics workspace
- Adjust polling intervals if ingestion exceeds expectations
- Consider disabling connectors for data you don't actively use
Conclusion
Integrating UniFi network data into Microsoft Sentinel provides valuable visibility into your infrastructure. Whether you're monitoring a home lab or an enterprise deployment, having network device status, firmware compliance, and ISP performance metrics alongside your security data enables better detection and response capabilities.
The modular connector approach means you can start small—perhaps just with device monitoring—and expand to include sites, hosts, and ISP metrics as your needs evolve.
The connectors are available on GitHub and I welcome contributions and feedback. If you encounter issues or have suggestions for improvements, please open an issue or submit a pull request.
Resources
- GitHub Repository
- UniFi Site Manager API Documentation
- Microsoft Sentinel CCF Documentation
- UniFi Site Manager

If you've enjoyed this content and would like to support more like it, please consider joining the Supporters Tier. Your support helps me continue creating practical security automation content for the community.