Extending UniFi Monitoring in Microsoft Sentinel: Workbooks and Analytics Rules

In my previous article, we explored how to integrate UniFi network monitoring into Microsoft Sentinel using the Codeless Connector Framework. With data now flowing from the UniFi Site Manager API into your Sentinel workspace, the next step is to visualise that data and create automated detections. This article covers the UniFi Site Manager Workbook and a set of analytical rules to start you on your journey designed to provide operational visibility for your UniFi infrastructure.
The UniFi Site Manager Workbook
The workbook provides a centralised dashboard for monitoring your entire UniFi deployment. Rather than querying logs manually or jumping between different views, you get an at-a-glance summary of device health, ISP performance, firmware compliance, and data connector status.
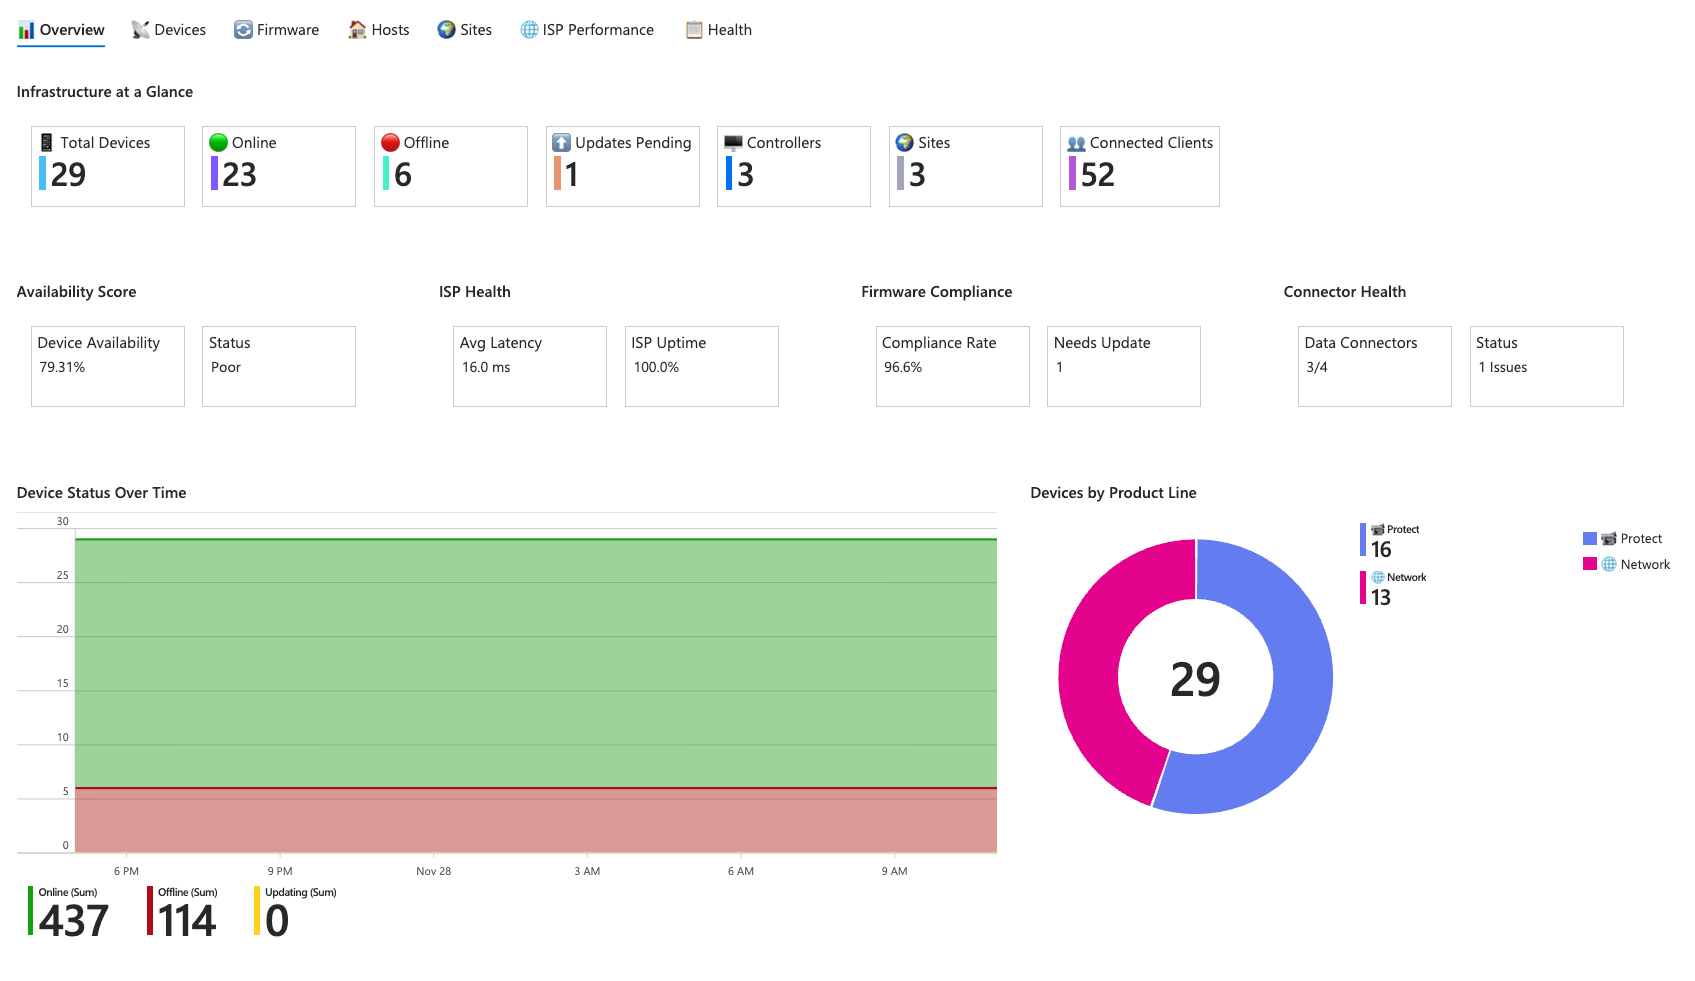
Overview Tab
The Overview tab serves as your landing page, presenting infrastructure metrics in a series of tiles. You can see total device counts alongside online, offline, and updating statuses. An availability score calculates the percentage of devices currently operational, with thresholds indicating whether your network health is excellent or if it's like mine, poor.
ISP health metrics surface average latency and uptime percentage, whilst firmware compliance tracking shows how many devices are running the latest firmware versus those with updates pending. The connector health section monitors data ingestion, alerting you if any of the four data tables haven't received data within the expected timeframe.
A time-series chart displays device status over time, allowing you to identify patterns or correlate outages with specific events. The chart correctly calculates distinct device counts per hour rather than cumulative sums, ensuring accurate representation of your fleet size.
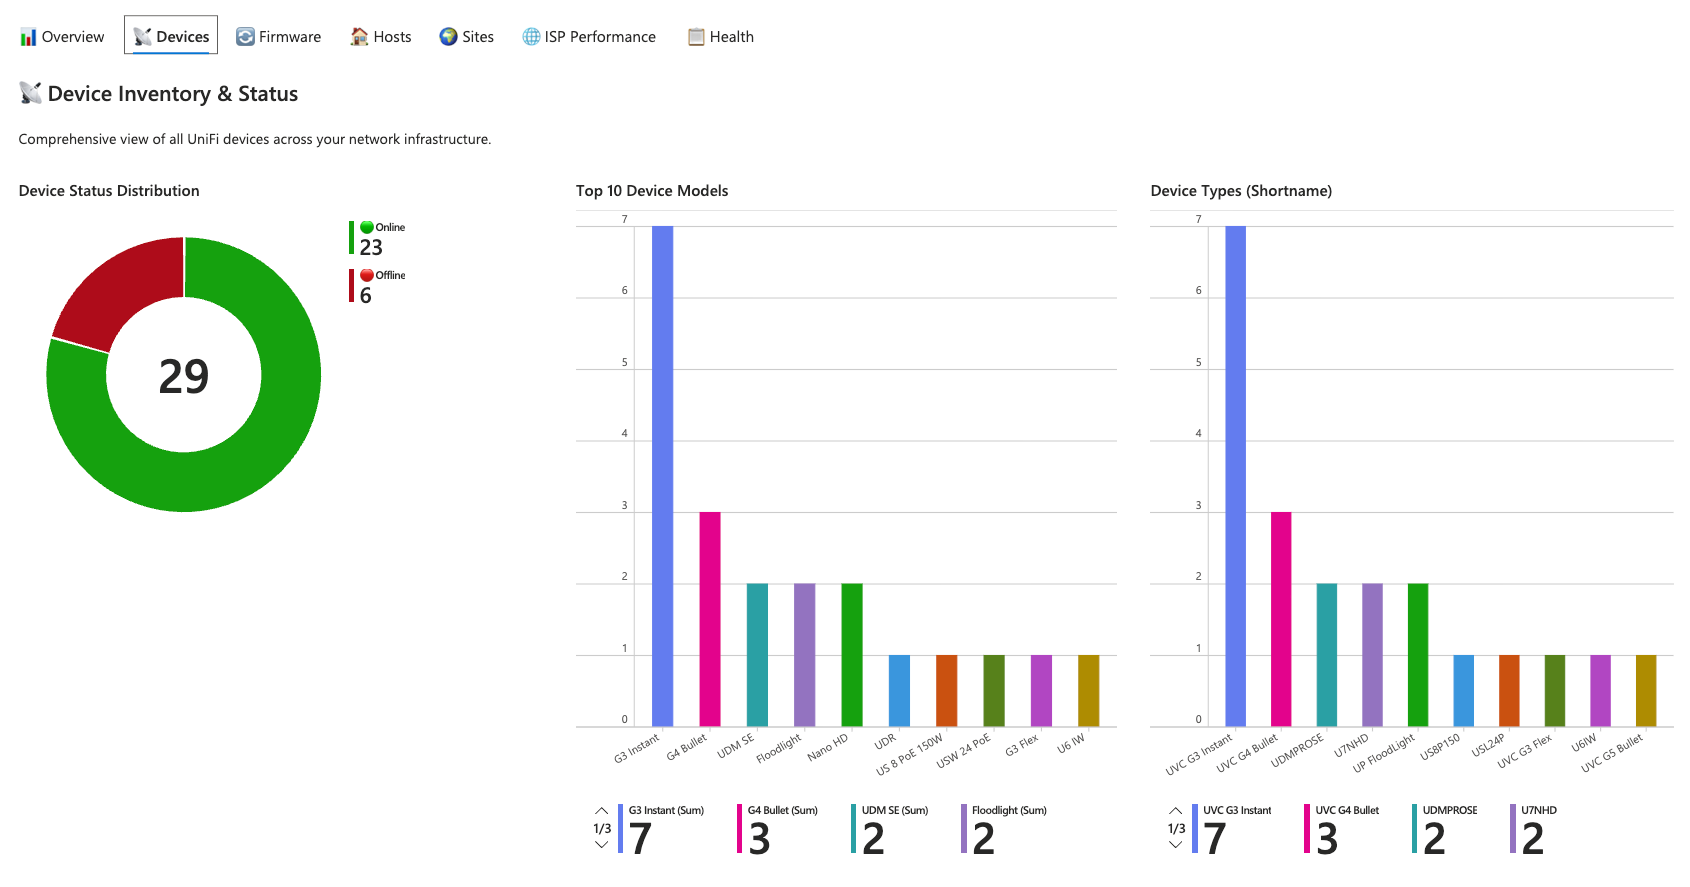
Device Monitoring
The Devices tab provides detailed inventory management. A pie chart breaks down device status distribution whilst bar charts show the most common device models and types across your deployment. The complete device inventory table supports searching, filtering, and Excel export for offline analysis.
Currently offline devices are highlighted with human-readable duration formatting. A device offline for 45 minutes displays as "45 mins", whilst one offline for 2 days shows "2 days". This makes it immediately apparent which outages are recent versus long-standing.
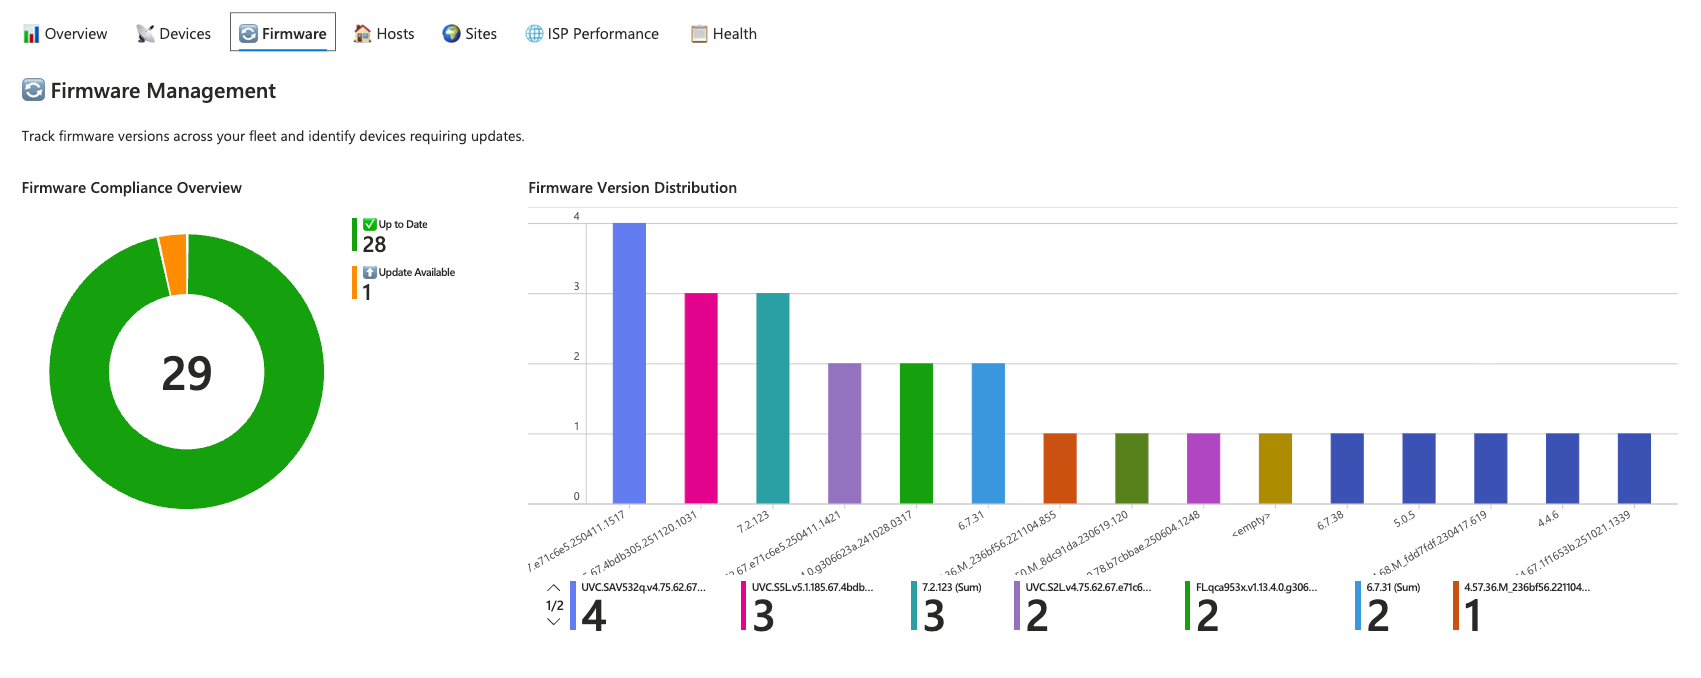
Firmware Management
Keeping firmware current is essential for security and stability. The Firmware tab visualises compliance as a pie chart comparing up-to-date devices against those with updates available. A distribution chart shows which firmware versions are most prevalent, helping identify clusters of outdated devices.
The devices requiring updates table lists each device alongside its current version and the available update version. Compliance percentages are broken down by product line, so you can quickly determine whether your access points, switches, or gateways need attention.
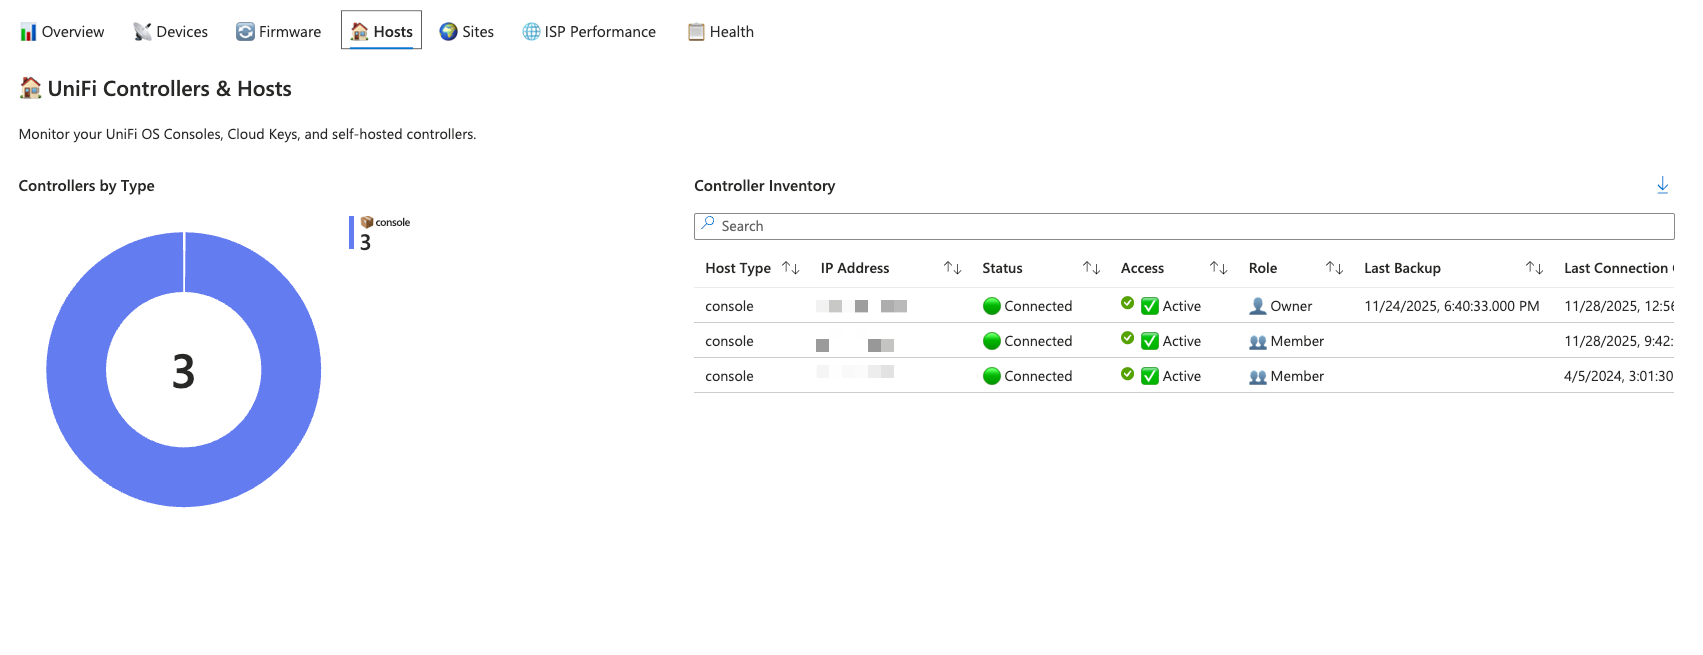
Hosts and Sites
The Hosts tab focuses on your UniFi controllers. Whether you're running UniFi OS Consoles, Cloud Keys, Dream Machines, or self-hosted Network Servers, the controller inventory provides visibility into IP addresses, connection status, remote access configuration, and backup status.
Sites are logical groupings of devices, and the Sites tab presents health status for each location. A site with zero offline devices shows as healthy, one or two offline devices triggers a warning status, and three or more marks the site as critical. Client distribution charts break down WiFi, wired, and guest connections per site.
ISP Performance
Internet connectivity issues can be difficult to diagnose without historical data. The ISP Performance tab surfaces metrics collected from the UniFi Site Manager API, including latency trends, packet loss events, bandwidth utilisation, and connection uptime.
Summary tiles display average latency, maximum latency spikes, total packet loss events, average uptime percentage, and accumulated downtime. Line charts track these metrics over time, making it straightforward to identify when performance degraded and whether it correlates with specific periods.
The ISP performance issues table filters for events exceeding defined thresholds: average latency above 50ms, maximum latency above 200ms, any packet loss, or any downtime. A site-by-site summary includes latency grades (Excellent, Good, Fair, Poor) and SLA compliance status based on a 99.9% uptime target.

Connector Health
The Health tab monitors the data connectors themselves. A status table shows each of the four connectors (Devices, Hosts, Sites, ISP Metrics) along with when data was last received, how long ago that was, and how many records arrived in the past 24 hours.
Status indicators follow a traffic light system: green for healthy (data within 15 minutes), yellow for delayed (15-60 minutes), orange for stale (1-6 hours), and red for critical (over 6 hours). A data ingestion volume chart visualises record counts over the past 24 hours, making gaps in data collection immediately visible.

Analytics Rules for Threat Detection
Whilst the workbook provides visibility, analytics rules provide automated detection. The rule set covers device health, firmware compliance, ISP performance, controller status, and data connector health. Each rule is provided as an ARM template for deployment via the Azure Portal, Azure CLI, or PowerShell.
Device Health Rules
Device Offline triggers when a device has been offline for more than 10 minutes. The rule runs every 15 minutes, looking back over the past hour to find devices with an offline status. Alert details include the device name, model, IP address, MAC address, product line, and how long the device has been offline.

Multiple Devices Offline escalates to high severity when three or more devices go offline simultaneously. This typically indicates a site-level issue such as a power outage, upstream connectivity failure, or infrastructure problem rather than individual device failures. The rule aggregates offline devices and lists affected product lines in the alert.

New Device Adopted generates an informational alert whenever a device is adopted into your UniFi network. Whilst usually legitimate, unexpected adoptions could indicate unauthorised hardware. The rule captures the adoption timestamp, device details, and product line.

Firmware and Security
Firmware Update Available runs daily to identify devices with pending firmware updates. Keeping firmware current is critical for security, as updates often contain patches for vulnerabilities. The rule summarises how many devices need updates and which models are affected.

ISP Performance Rules
ISP High Latency detects when average latency exceeds 100ms or maximum latency exceeds 500ms. High latency impacts VoIP quality, video conferencing, and real-time applications. The alert includes ISP name, site identifier, and latency measurements.

ISP Packet Loss triggers on any detected packet loss. Even small amounts of packet loss significantly impact application performance. The rule aggregates packet loss events and provides context about the affected ISP and site.

ISP Downtime fires whenever the ISP connection experiences downtime. Any outage impacts business operations and should be documented for SLA tracking purposes. The alert calculates total downtime in minutes and includes average uptime percentage.

ISP SLA Breach monitors whether uptime falls below the 99.9% SLA target. This rule helps track ISP accountability and provides evidence for contract negotiations. The alert shows average uptime, minimum uptime, and how far below the SLA target performance has fallen.

Controller and Site Health
Controller Connection State Change detects when UniFi controllers experience connection state changes. Dream Machines, Cloud Keys, and other controllers are critical infrastructure. Connection changes could indicate network issues, power problems, or controller failures.

Site Health Critical triggers when a site has three or more offline devices. This escalates individual device failures to a site-level incident requiring immediate attention. The alert includes the site name, device counts, availability percentage, and affected client count.

Data Connector Monitoring
Data Connector Health monitors whether data is being ingested from each of the four UniFi data tables. If any connector stops receiving data for more than 30 minutes, the rule generates an alert. This ensures you're notified if visibility into your UniFi infrastructure is compromised.

MITRE ATT&CK Mapping
Each rule is mapped to relevant MITRE ATT&CK tactics and techniques. Device offline and downtime rules map to Impact (T1489 Service Stop, T1499 Endpoint Denial of Service). New device adoption maps to Initial Access (T1200 Hardware Additions) and Persistence (T1133 External Remote Services). Firmware update rules map to Initial Access (T1190 Exploit Public-Facing Application). Data connector health rules map to Defense Evasion (T1562 Impair Defenses).
Sub-techniques provide additional granularity. ISP performance rules include T1498.001 (Direct Network Flood) and T1499.004 (Application or System Exploitation). Controller connection rules include T1071.001 (Web Protocols). This mapping ensures your UniFi detections integrate with broader threat intelligence and SOC workflows.
Incident Grouping and Alert Management
All rules include incident grouping configuration to reduce alert fatigue. Device-based rules group by host entity, so multiple alerts for the same device consolidate into a single incident. Site-based rules group by site identifier, ISP-based rules group by site and ISP name, and connector rules group by table name.
Suppression is enabled on most rules to prevent duplicate alerts within short timeframes. For example, the Device Offline rule suppresses for one hour after firing, whilst the ISP Downtime rule suppresses for 30 minutes. These values can be adjusted in the ARM templates to match your operational requirements.
Deployment
Workbook Deployment
The workbook is deployed by importing the JSON template into Microsoft Sentinel. Navigate to Sentinel, select Workbooks under Threat Management, click Add Workbook, and switch to the Advanced Editor. Paste the workbook JSON and save. The workbook requires data in all four UniFi tables to display meaningful information.
Analytics Rule Deployment
Each analytics rule is provided as an individual ARM template. The simplest deployment method is through the Microsoft Sentinel Analytics blade. Click Import, select the JSON file, and the rule will be created with all configurations intact.
For automated deployment across multiple workspaces, use Azure CLI:
bash
az deployment group create \
  --resource-group <resource-group> \
  --template-file UniFi-Device-Offline.json \
  --parameters workspace=<workspace-name>
Or PowerShell:
powershell
New-AzResourceGroupDeployment `
  -ResourceGroupName "<resource-group>" `
  -TemplateFile "UniFi-Device-Offline.json" `
  -workspace "<workspace-name>"
Customising Thresholds
Default thresholds are defined as variables at the beginning of each rule's KQL query. To change when the Device Offline rule triggers, modify the OfflineMinutes variable from 10 to your preferred value. To adjust how many devices constitute a mass offline event, change the OfflineThreshold variable in the Multiple Devices Offline rule.
Query frequency and period can be adjusted in the ARM template properties. Note that queryPeriod must be greater than or equal to queryFrequency to avoid validation errors.
Summary
The UniFi Site Manager Workbook and Analytics Rules extend your Microsoft Sentinel deployment with visibility and detection capabilities for UniFi Site Manager infrastructure. The workbook provides operational dashboards for device health, firmware compliance, ISP performance, and connector status. The analytics rules automate threat detection and alerting across eleven distinct scenarios, from individual device failures to ISP SLA breaches.
All resources are available on GitHub and can be deployed using the Deploy to Azure buttons, Azure CLI, PowerShell, or manual ARM template deployment. With data connectors collecting information from the UniFi Site Manager API and these visualisation and detection tools in place, you have end-to-end monitoring for your UniFi Sites within Microsoft Sentinel.

If you've enjoyed this content and would like to support more like it, please consider joining the Supporters Tier. Your support helps me continue creating practical security automation content for the community.